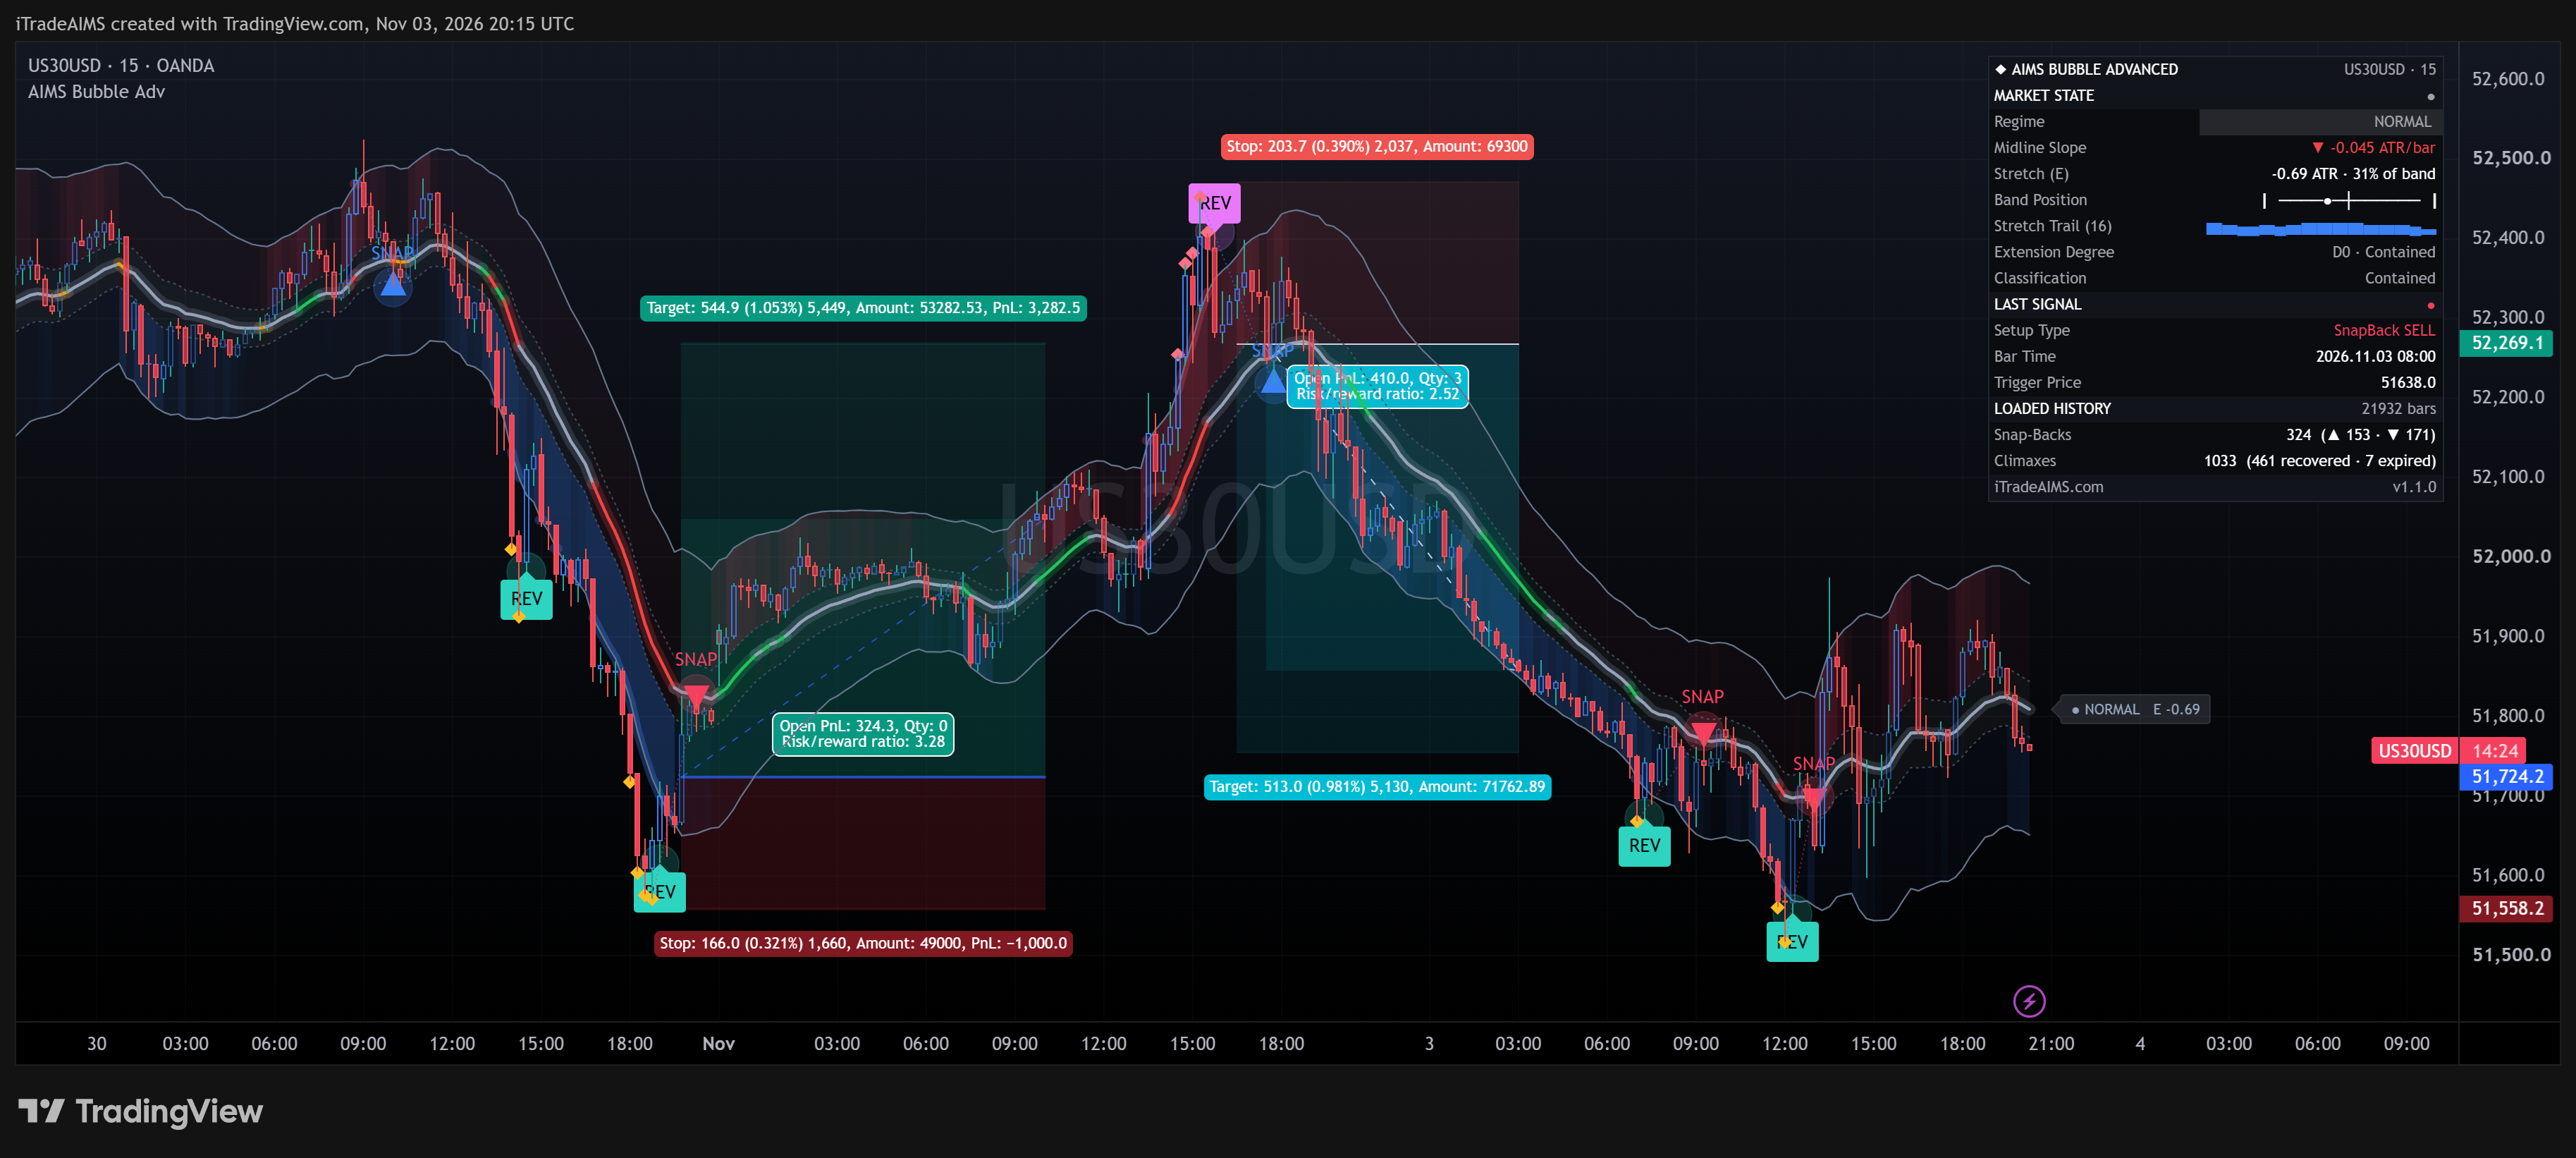
What AIMS Bubble does
The AIMS Bubble Indicator replaces arbitrary overbought and oversold indicators with objective mathematical boundaries. Grounded in Adam Grimes statistical distribution models, it encloses price action within 2.25x ATR containment corridors to identify two distinct market regimes: high-probability Snap-Back pullbacks to fair value during trends, and extreme Climax exhaustion fades when volatility bubbles stretch beyond normal bounds.
Adam Grimes Containment
Dynamic 2.25x ATR outer containment corridors enclosing approximately 85% of standard price distribution.
Normalized Stretch (E)
Calculates price deviation in pure ATR units: E = (Close − Midline) / ATR(20), classified into D0 Normal through D3 Climax.
Dual Execution Invariant
Operates across both trend continuation (Snap-Back pullbacks) and range exhaustion (Fade Climax reversals) on strict candle close.
How to trade AIMS Bubble
Assess Midline Slope & Regime Bias
The 20 EMA Midline establishes fair value. Upward sloping midline confirms bullish continuation; downward sloping confirms bearish bias; flat midline flags range conditions.
Inspect Stretch Metric (E) Telemetry
Read the HUD status blotter. D0 (< 1.0 ATR) confirms equilibrium; D1-D2 confirm active momentum; D3 (> 2.25 ATR) signals volatility bubble exhaustion.
Execute on Confirmed Bar Close
Wait for the candle to close definitively. Snap-Back triggers upon pullback test of the Centre Band (1.0x ATR); Fade triggers upon rejection wick piercing outer 2.25x ATR bands.
Manage Risk with the Trade Ladder
Anchor Stop Loss beyond the outer containment band or recent swing fractal. Scale out at 1.0x ATR equilibrium, letting runners target the opposing boundary.
Prompts, not trade instructions. A SETUP READY prompt tells you to review the structure on a closed candle. It is never a command to enter blindly.
Setups and chart grammar
The Bubble Indicator separates trend continuation from statistical exhaustion.
| Setup | Context | What the indicator sees | Goal |
|---|---|---|---|
| Snap-Back — Trend Pullback | Active trending market | Price tests the 1.0x ATR Centre Band / 20 EMA with sloping baseline | Join the established trend at equilibrium fair value |
| Fade — Climax Exhaustion | Extended trend or range boundary | Price pierces the outer 2.25x ATR containment band (Stretch E > 2.25) | Fade the statistical extreme back toward the 20 EMA midline |
Price trading within normal ±1.0x ATR fair-value corridor.
Price between 1.0x and 2.25x ATR (D1-D2) — momentum active, do not fade.
Snap-back pullback confirmation or oversold D3 climax recovery.
Snap-back pullback confirmation or overbought D3 climax recovery.
The Volatility Stretch Metric (E)
Standardized volatility distance from the 20 EMA fair-value baseline measured in ATR units.
Stretch (E) = (Close − 20 EMA) / ATR(20)
if |E| > 2.25  →  D3 Bubble Climax (Fade Zone / No Breakout Entries)
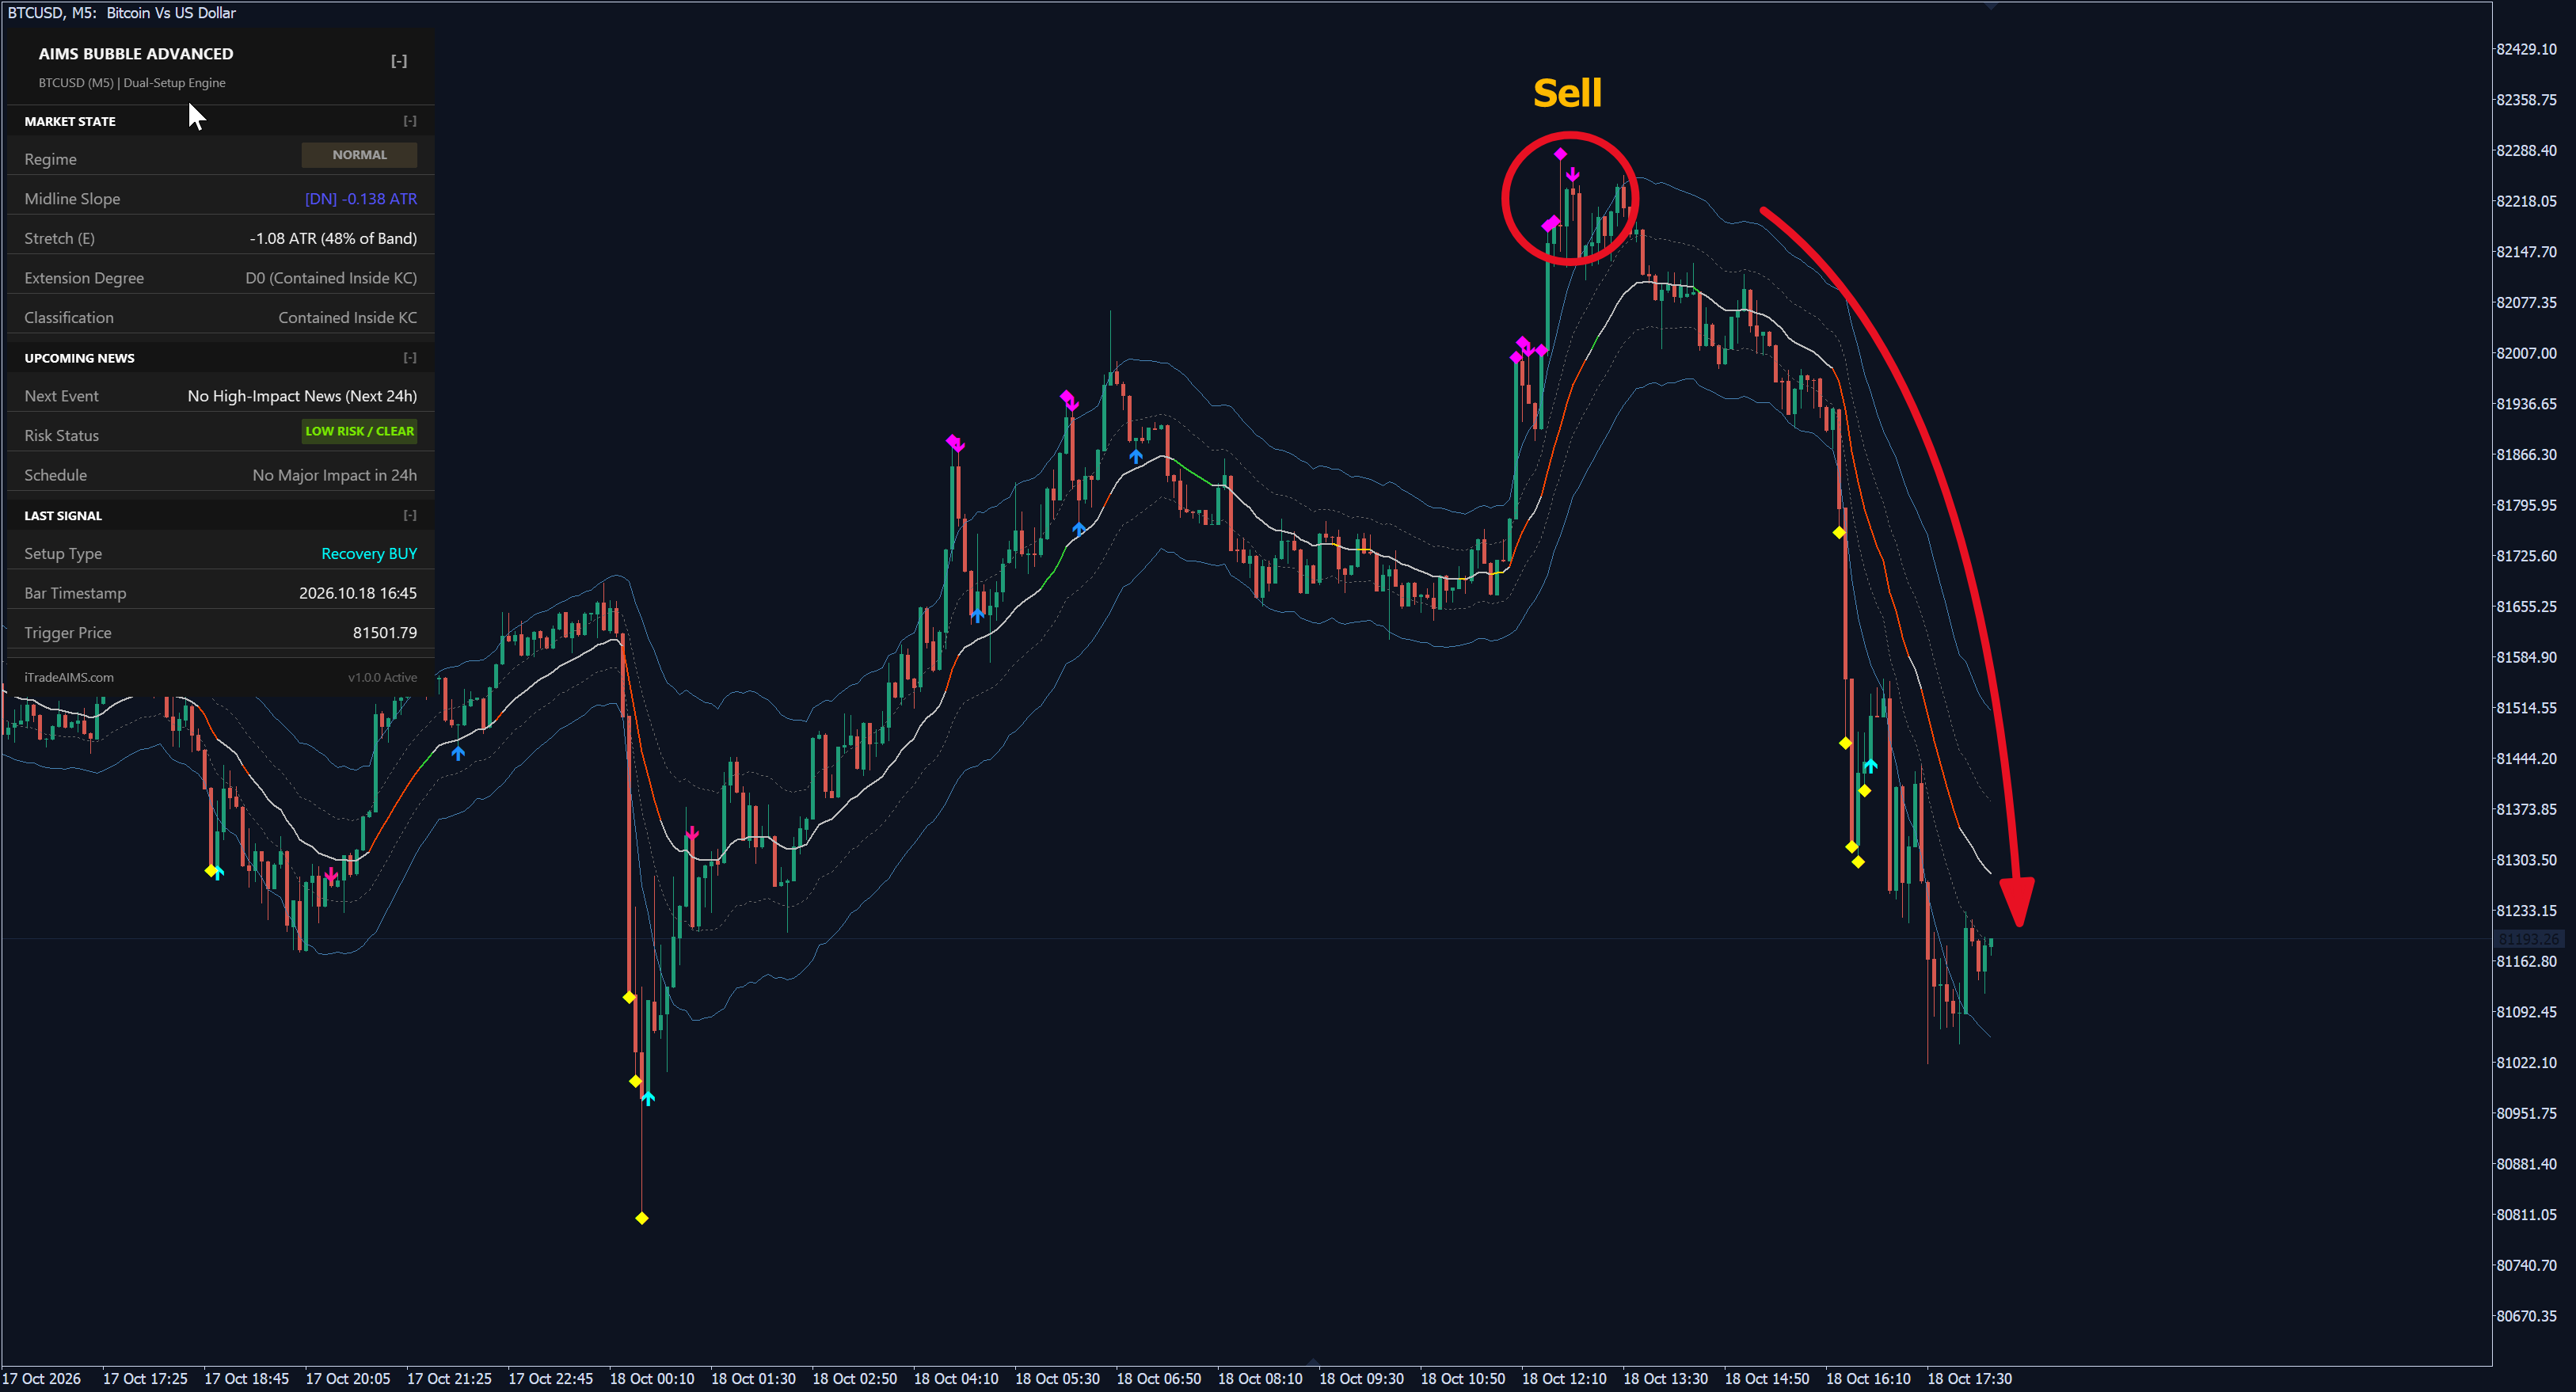
Settings
| Input | Type | Default | What it does |
|---|---|---|---|
| Preset Profile | String | Universal | Calibrated champion profiles: Universal, US30, NAS100, Gold, GBPJPY, GER40, or Custom. |
| Midline Period (EMA) | Integer | 20 | Fair-value center baseline length. |
| ATR Period | Integer | 20 | Volatility normalization lookback period. |
| Containment Multiplier | Float | 2.25 | Adam Grimes outer boundary enclosing ~85% of price distribution. |
| Centre Multiplier | Float | 1.0 | Inner equilibrium re-entry / snap-back zone. |
| Enable Fade Signals | Boolean | true | Climax reversal signals on containment boundary breaches. |
| Enable Snap-Back Signals | Boolean | true | Trend continuation pullback signals after extension episode. |
| Fade Cooldown Bars | Integer | 10 | Minimum bars between consecutive same-direction Fade signals. |
| Input | Type | Default | What it does |
|---|---|---|---|
| InpMidlinePeriod | int | 20 | Fair-value 20 EMA Midline Period. |
| InpATRPeriod | int | 20 | Volatility ATR Period. |
| InpCentreMult | double | 1.0 | Centre Band Multiplier (Re-entry Zone). |
| InpContainmentMult | double | 2.25 | Containment Band Multiplier (Adam Grimes outer envelope). |
| InpEnableTier1Marker | bool | true | Enable Tier 1 Exhaustion Markers (Yellow/Magenta Diamond warning). |
| InpEnableTier2Recovery | bool | true | Enable Tier 2 Recovery Arrows (Aqua/Magenta actionable trigger). |
| InpEnableSnapBack | bool | true | Enable Centre-Band Snap-Back continuation arrows. |
| InpEpisodeLookback | int | 20 | Max bars awaiting pullback before extension episode expires. |
| Input | Type | Default | What it does |
|---|---|---|---|
| InpSerialKey | string | "" | Member Portal serial key for DLMS license verification. |
| InpMidlinePeriod | int | 20 | Fair-value 20 EMA Midline lookback. |
| InpATRPeriod | int | 20 | Volatility ATR Period. |
| InpCentreMult | double | 1.0 | Inner Centre Band Multiplier (1.0x ATR). |
| InpContainmentMult | double | 2.25 | Outer Containment Multiplier (2.25x ATR). |
| InpEnableSnapBack | bool | true | Enable Snap-Back trend pullback signals. |
| InpEnableFade | bool | false | Enable counter-trend Fade signals (opt-in for climax reversals). |
Use it in your EA
On MetaTrader you can read the levels and setup state from an Expert Advisor with iCustom().
// MQL5 — Read AIMS Bubble MT5 buffers on completed candle close
int    h = iCustom(_Symbol, _Period, "AIMSBubbleMT5");
double v[];
CopyBuffer(h, 0, 1, 1, v); // Buffer 0 = Midline, Buffer 4 = Containment Upper| Buffer | Name | Value |
|---|---|---|
| 0 | Bubble Midline | 20 EMA fair-value baseline line |
| 1 | Centre Upper | 1.0x ATR inner corridor upper bound |
| 2 | Centre Lower | 1.0x ATR inner corridor lower bound |
| 3 | Containment Upper | 2.25x ATR Adam Grimes outer upper boundary |
| 4 | Containment Lower | 2.25x ATR Adam Grimes outer lower boundary |
| 5 | SnapBack Buy | Price value for Snap-Back continuation buy arrow |
| 6 | SnapBack Sell | Price value for Snap-Back continuation sell arrow |
| 7 | Tier 2 Recovery Buy | Price value for Super Stretched Recovery buy arrow |
| 8 | Tier 2 Recovery Sell | Price value for Super Stretched Recovery sell arrow |
Frequently asked questions
The AIMS Bubble Indicator is an institutional volatility band and equilibrium framework. Grounded in Adam Grimes statistical distribution models, it encloses standard price action within 2.25x ATR containment bands. It identifies two specific setups: Snap-Back continuation pullbacks to fair value (Centre Bands), and Fade Climax exhaustion when volatility bubbles pierce outer boundaries.