AIMS eWaves Super
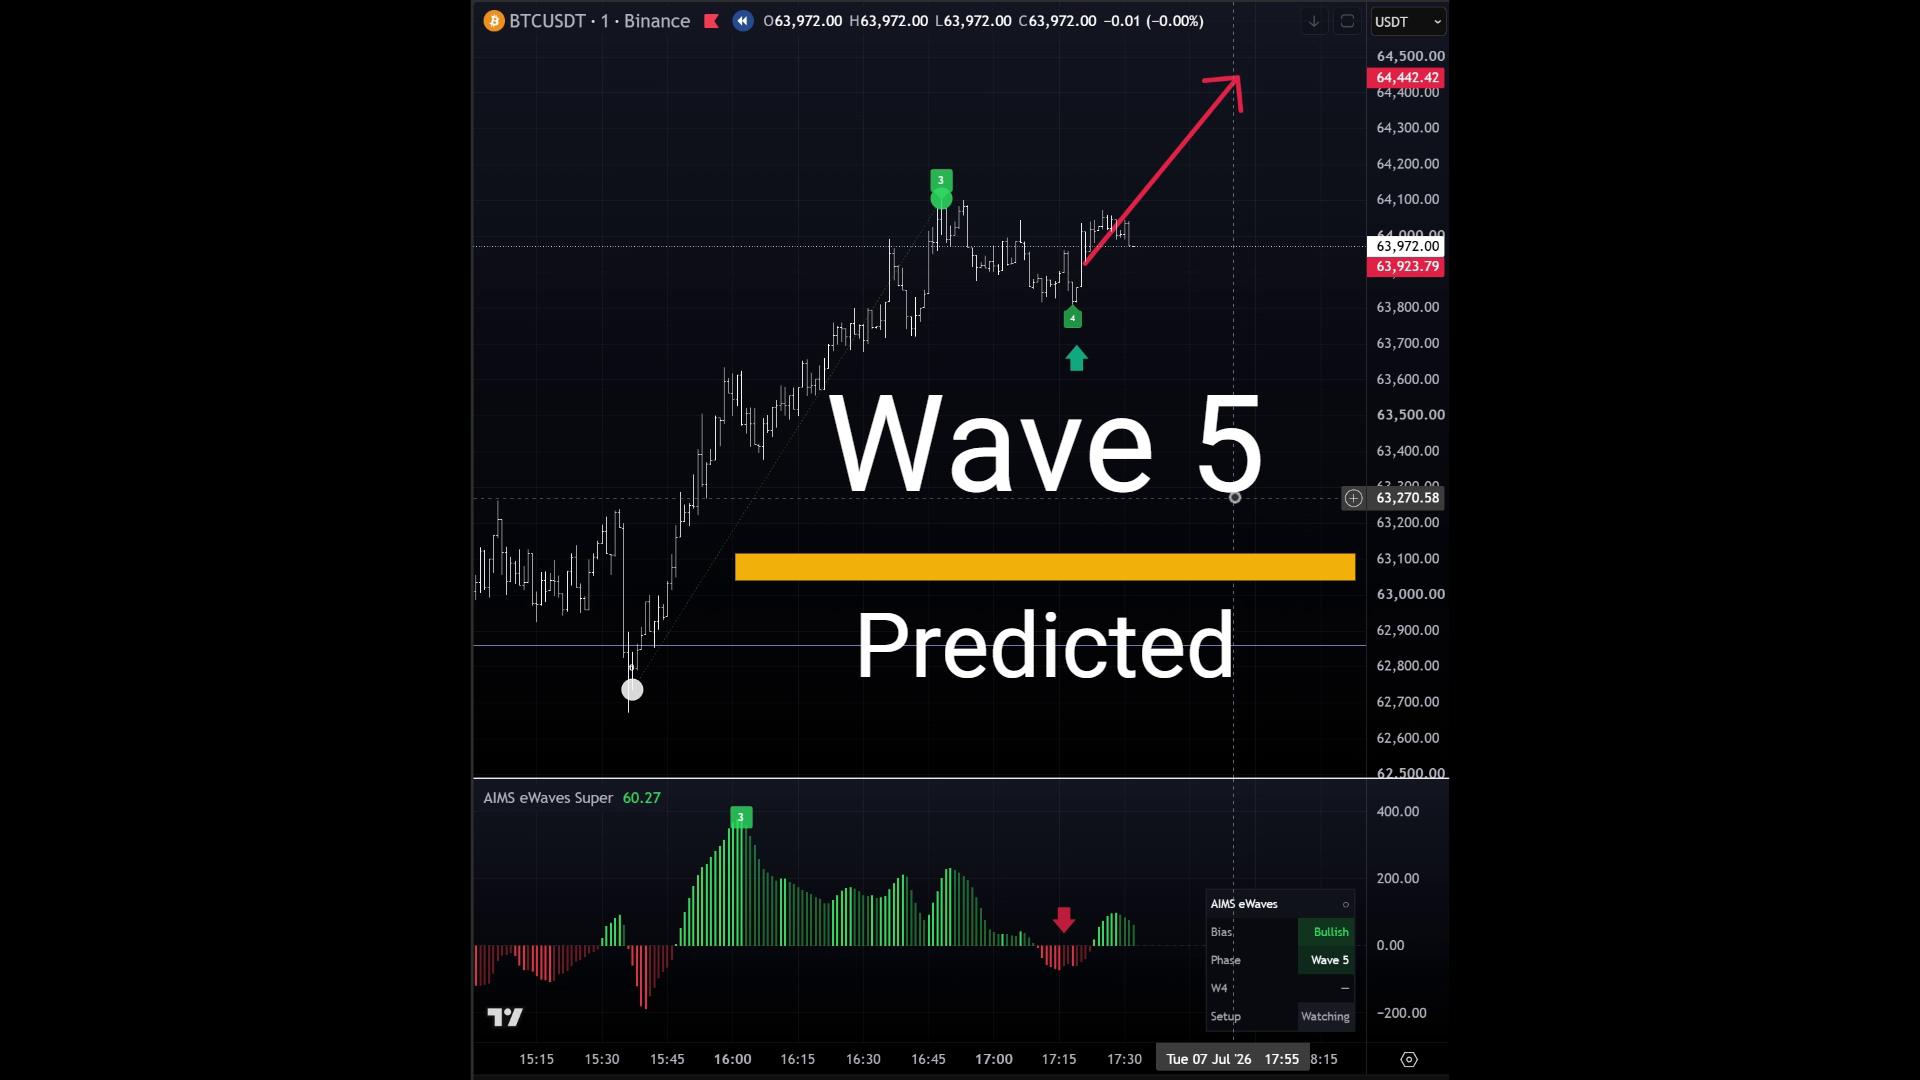
AIMS eWaves Super eliminates the ambiguity of manual wave counting across TradingView and MetaTrader 5. By automatically classifying 5-wave impulse cycles, Wave 4 pullbacks, Wave 5 exhaustion extensions, and projecting mathematical Target Zones (TZ1 & TZ2), it transforms complex wave theory into actionable, rule-based chart clarity.
Markets breathe in structural cycles. By anchoring automatically to verified fractal pivots and Awesome Oscillator (AO) lobes, the indicator delivers a standardized structural roadmap with zero subjective interpretation.
- AIMS Wave (Free Version): Clean, lightweight oscillator histogram displaying market rhythm (no automated wave counts).
- AIMS eWaves Super (This Guide): The automated AO-lobe Elliott counter with automated 1–5 impulse sequences, Wave 4 pullbacks, and Target Zones (TZ1 & TZ2).
- AIMS eWaves Pro: Institutional price-native ATR-zigzag node chain with multi-degree nested counts and confidence scoring.
How to Trade AIMS eWaves Super?
- Wave 3 Main Impulse: Never fade expanding Wave 3 momentum; ride the trend with wide candlestick expansion.
- Wave 4 Pullback Entry: Look for controlled, shallow pullbacks retracing 38.2% to 50% toward the Awesome Oscillator baseline.
- Setup 1 Alignment: Enter continuation setups when Wave 4 consolidation aligns with AIMS Box or Banana triggers.
- Target Zone Harvesting: Take profits systematically as price penetrates objective Target Zones (TZ1 and TZ2).
- Wave 5 Exhaustion Warning: Diverging momentum lobes at new price extremes signal late-cycle exhaustion; avoid new breakout entries.
A minimum bar depth filter ensures calculations lock onto stable structural anchors.
AIMS eWaves Super Settings Highlights
- Lookback History Depth: Scans 100–150 completed bars to stabilize wave anchor point 0 (default: 120).
- Maximum History Bars: Total bar depth evaluated across active charts (default: 250).
- Print Wave Labels: Displays numerical labels (3, 4, 5) on confirmed bar close (default: Enabled).
- Show Target Zones: Projects mathematical TZ1 and TZ2 corridors ahead of price action (default: Enabled).
- Quality Filter Band: Enforces strict Fibonacci retracement depths for high-probability setups (default: HIGH + CAUTION).
An AIMS signal marker is an algorithmic prompt to review market structure, never an automated command to enter blindly. Always wait for the candle to close definitively, verify confluence with your trading plan, and manage risk first.
Signal Detection & Mechanics
AIMS eWaves Super breaks complex multi-fractal price action into four distinct, rule-based structural phases:
Visual Signals & Chart Anatomy
- 1. Wave 3 Main Impulse: The strongest, most directional wave leg. Accompanied by expanding Awesome Oscillator (AO) lobes and wide candlestick expansion. AIMS eWaves Super tracks Wave 3 momentum without attempting premature counter-trend fades.
- 2. Wave 4 Pullback & Correction: A controlled, shallow correction following Wave 3. Typically retraces between 38.2% and 50% of the Wave 3 expansion. This is the primary institutional entry zone when aligned with AIMS Box Setup 1 or Banana continuation signals.
- 3. Wave 5 Late Extension: The final exhaustion push in the impulse sequence. While price often makes a new extreme, momentum oscillator lobes show pronounced divergence (deceleration). Risk escalates; reward-to-risk shrinks dramatically.
- 4. Objective Target Zones (TZ1 & TZ2): Mathematically calculated price corridors projected ahead of price. TZ1 marks the conservative stall zone, while TZ2 marks maximum expected extension. Ideal for systematic profit harvesting.
The 100–150 History Bars Rule
Elliott wave algorithms require sufficient completed price history to anchor point 0 and accurately measure wave proportions.
| Inspection Step | Requirement | Why It Matters |
|---|---|---|
| Bar History Depth | 100–150 closed bars | Short history prevents full 1–5 impulse detection and causes premature count recalculations. |
| Timeframe Alignment | M5, M15, H1, H4 | Select timeframe before anchoring; wave counts scale to the active chart resolution. |
| Attach Stabilization | Wait 1–2 closed bars | Allows the calculation engine to calibrate AO lobes across full historical depth. |
Multi-Timeframe Analysis: Counting Waves Within Waves
Financial markets are inherently fractal: every primary impulse wave and corrective pullback on a higher timeframe is composed of its own smaller, sub-degree wave cycles on a lower timeframe. Understanding and tracking this relationship transforms Elliott Wave analysis into a precise, rule-based execution methodology.
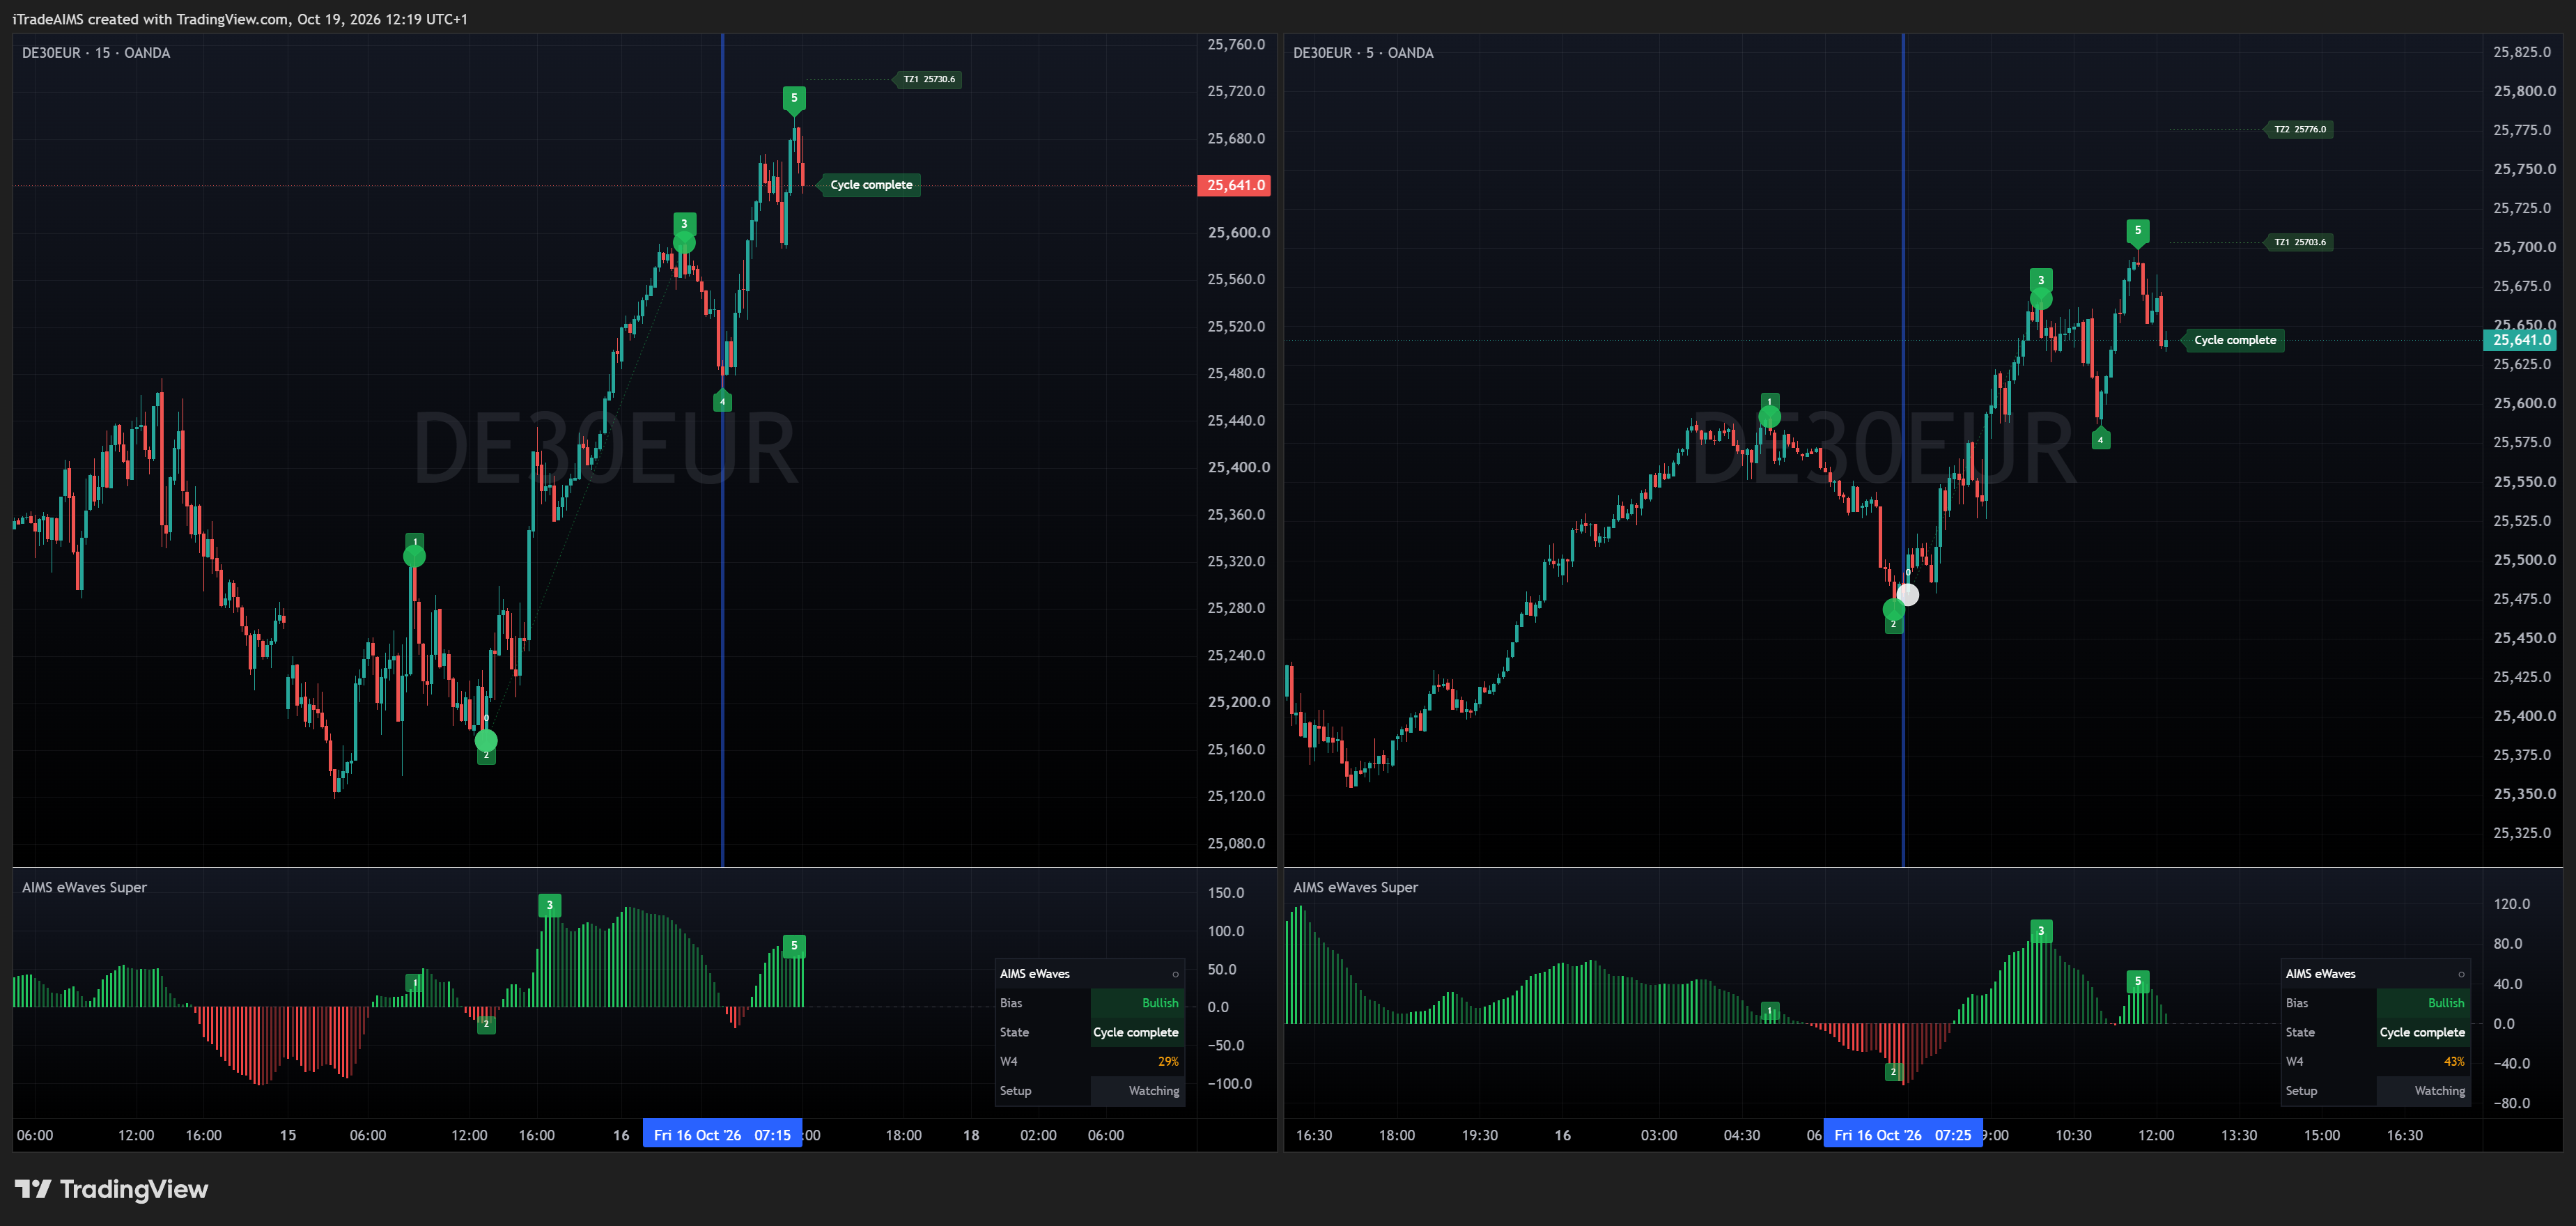
Interactive TradingView Snapshot: DE30EUR Multi-Timeframe Synchronized Cycle
The Fractal Structure in Action
In the synchronized TradingView chart above across the German DAX (DE30EUR):
-
Higher Timeframe Context (15-Minute, Left Chart):
- Price advances in a powerful Wave 3 impulse before entering a controlled, shallow Wave 4 pullback (marked by the synchronized vertical crosshair at
07:15). - The Awesome Oscillator (AO) decelerates back toward the zero baseline, confirming that the corrective phase is maturing and preparing for the final Wave 5 push toward Target Zone 1 (
TZ1: 25730.6).
- Price advances in a powerful Wave 3 impulse before entering a controlled, shallow Wave 4 pullback (marked by the synchronized vertical crosshair at
-
Lower Timeframe Microstructure (5-Minute, Right Chart):
- Zooming into the exact bar of the 15-minute Wave 4 low (vertical crosshair at
07:25), the 5-minute chart reveals the inception of a complete internal sub-cycle. - Point 0 anchors at the swing low, followed by a sharp Wave 1 thrust and a textbook shallow Wave 2 retracement.
- As the 15-minute chart resumes its Wave 5 impulse, the 5-minute sub-cycle unleashes an internal Wave 3, Wave 4, and Wave 5 sequence directly into its own Target Zones (
TZ1: 25703.6,TZ2: 25776.0) before printing a Cycle complete confirmation.
- Zooming into the exact bar of the 15-minute Wave 4 low (vertical crosshair at
The Multi-Timeframe Advantage
- Pinpoint Wave 4 Bottoms: Rather than trying to predict the exact price turn on a 15-minute or 1-hour chart, switch to a lower timeframe (e.g. 5-minute or 1-minute) and wait for AIMS eWaves Super to print the Point 0 anchor and confirm a Wave 2 swing low.
- Tighter Invalidation & Asymmetric R:R: Entering on the lower-timeframe Wave 2 allows placing a compact stop loss just beneath the internal pivot, while aiming for the much larger higher-timeframe Wave 5 Target Zones (TZ1 / TZ2).
- Double Target Confluence: When the lower-timeframe sub-cycle flags Cycle complete at the exact moment price penetrates the higher-timeframe Target Zone, you have institutional confirmation to harvest profits ahead of any impending reversal or consolidation.
Video Walkthrough
Learn how professional traders use AIMS Wave to stop chasing extended Wave 3 moves and identify high-probability Wave 4 pullbacks:
Settings reference
Standard parameters across TradingView and MetaTrader 5 editions of AIMS eWaves Super:
| Parameter / Input | Default | Function & Guidance |
|---|---|---|
| Completed bars searched for W3 | 120 | How far back the wave detection logic scans to identify the anchor impulse peak. |
| Maximum history bars | 250 | Total bar depth evaluated; align with the 100–150 bars rule for optimal stability. |
| Print wave 3/4/5 labels | true | Toggles on-chart visual numerical labels for major impulse and pullback phases. |
| Show Target Zones (TZ1 & TZ2) | true | Renders mathematical target projection corridors ahead of current price action. |
| Quality Filter Band | HIGH + CAUTION | Limits W4 cues to strict Fibonacci retracement depths (38.2%–50% vs extended 25%–61.8%). |
| Alert on completed Bar 1 | true | Fires audio, popup, or webhook notifications only after candle closes, preventing false alerts. |
Platforms and how to get it
AIMS eWaves Super is available on TradingView and MetaTrader 5:

Official Pine Script v6 indicator with automated wave labeling, Target Zones, desk blotter telemetry, and multi-timeframe capability.

Institutional MQL5 indicator offering discrete calculation buffers, multi-symbol capability, and Confluence Suite integration.

Next Steps & Academy
AIMS eWaves Pro
Upgrade to price-native ATR-zigzag node chains, multi-degree counts, and confidence scoring.
Free Community ToolAIMS Wave (Free Version)
Explore the classic clean oscillator histogram and market rhythm indicator.
Market StructureAIMS Box Indicator
Pair Wave 4 corrections with fractal breakout boxes and Setup 1/2 triggers.
Frequently Asked Questions
AIMS eWaves Super automates Elliott Wave cycle recognition. It classifies 5-wave impulse cycles, pinpoints shallow Wave 4 pullbacks, and projects mathematical Target Zones (TZ1 & TZ2) where late-stage exhaustion typically occurs.
Need direct assistance? Contact Support.