Liquidity Box Quick Start
Use this page after you can open AIMS Liquidity Box on your TradingView username. For product context, see AIMS Liquidity Box.
TradingView does not use a Windows installer. Access is granted to a TradingView username; then you add the invite-only script to a chart.
SETUP READY is a cue to place a pending order if it fits your plan. It is not an automatic trade.
Before you start
Confirm:
- You are signed in to the TradingView username that holds the grant.
- TradingView no longer shows an invite-only block for AIMS Liquidity Box / AIMS Liq Box.
- You have a chart open on a symbol and timeframe you normally use for box setups (intraday through H1/H4 are typical).
- The chart has enough history loaded so Support & Resistance zones can form.
If access is still pending, see Get TradingView access.
1. Add the indicator to your chart
- Open your chart.
- Add iTradeAIMS | AIMS Liquidity Box from Indicators / Invite-only scripts (or from your granted script page when published).
- Accept defaults on first attach.
- Confirm the chart legend lists AIMS Liquidity Box or AIMS Liq Box.
You should see grey structure boxes and, when history is loaded, teal / red S&R bands. This product does not draw Gator lines or recolour candles.
2. Leave defaults for the first session
Do not change settings yet. Useful first-session defaults:
| Area | Default | Why leave it |
|---|---|---|
| 1 · Box | Fractal bars 5 | Standard box confirmation |
| 2 · Filters | ATR box-size filter on | Oversized boxes can still draw but will not arm a setup |
| 3 · Trade Levels | TP1 1.0× · TP2 2.0× · Show TP zones on | Clear risk/reward picture |
| 4 · Support & Resistance | Show S&R on · Detection Donchian | Liquidity context visible |
| 5 · Confluence | Flag setups at S&R on · Only arm near S&R off | Learn the ★ flag before hard-filtering |
| 6 · Display | Keep signals Last 3 | Recent setups stay visible |
| 7 · Dashboard | Show on | Live readout while you learn |
| 8 · Alerts | Enable alerts on when you are ready | Create alerts only after the chart reads correctly |
Full group reference: Liquidity Box settings.
3. Read your first chart
Structure and SETUP READY
| On chart / dashboard | Meaning |
|---|---|
| Grey structure box | Fractal high/low range; may tint when a setup arms |
| Dashboard Setup: Ready - Setup 1/2 | Cue to consider a pending stop |
| Order row | BuyStop or SellStop at a price |
| Stop / TP1 / R:R | Opposite edge, first target, and reward vs risk |
Long: Buy Stop at the top of the box · stop at the bottom.
Short: Sell Stop at the bottom · stop at the top.
Lifecycle after ready: Ready → Triggered (price hits the pending edge) → Invalidated (new box or opposite edge breaks first).
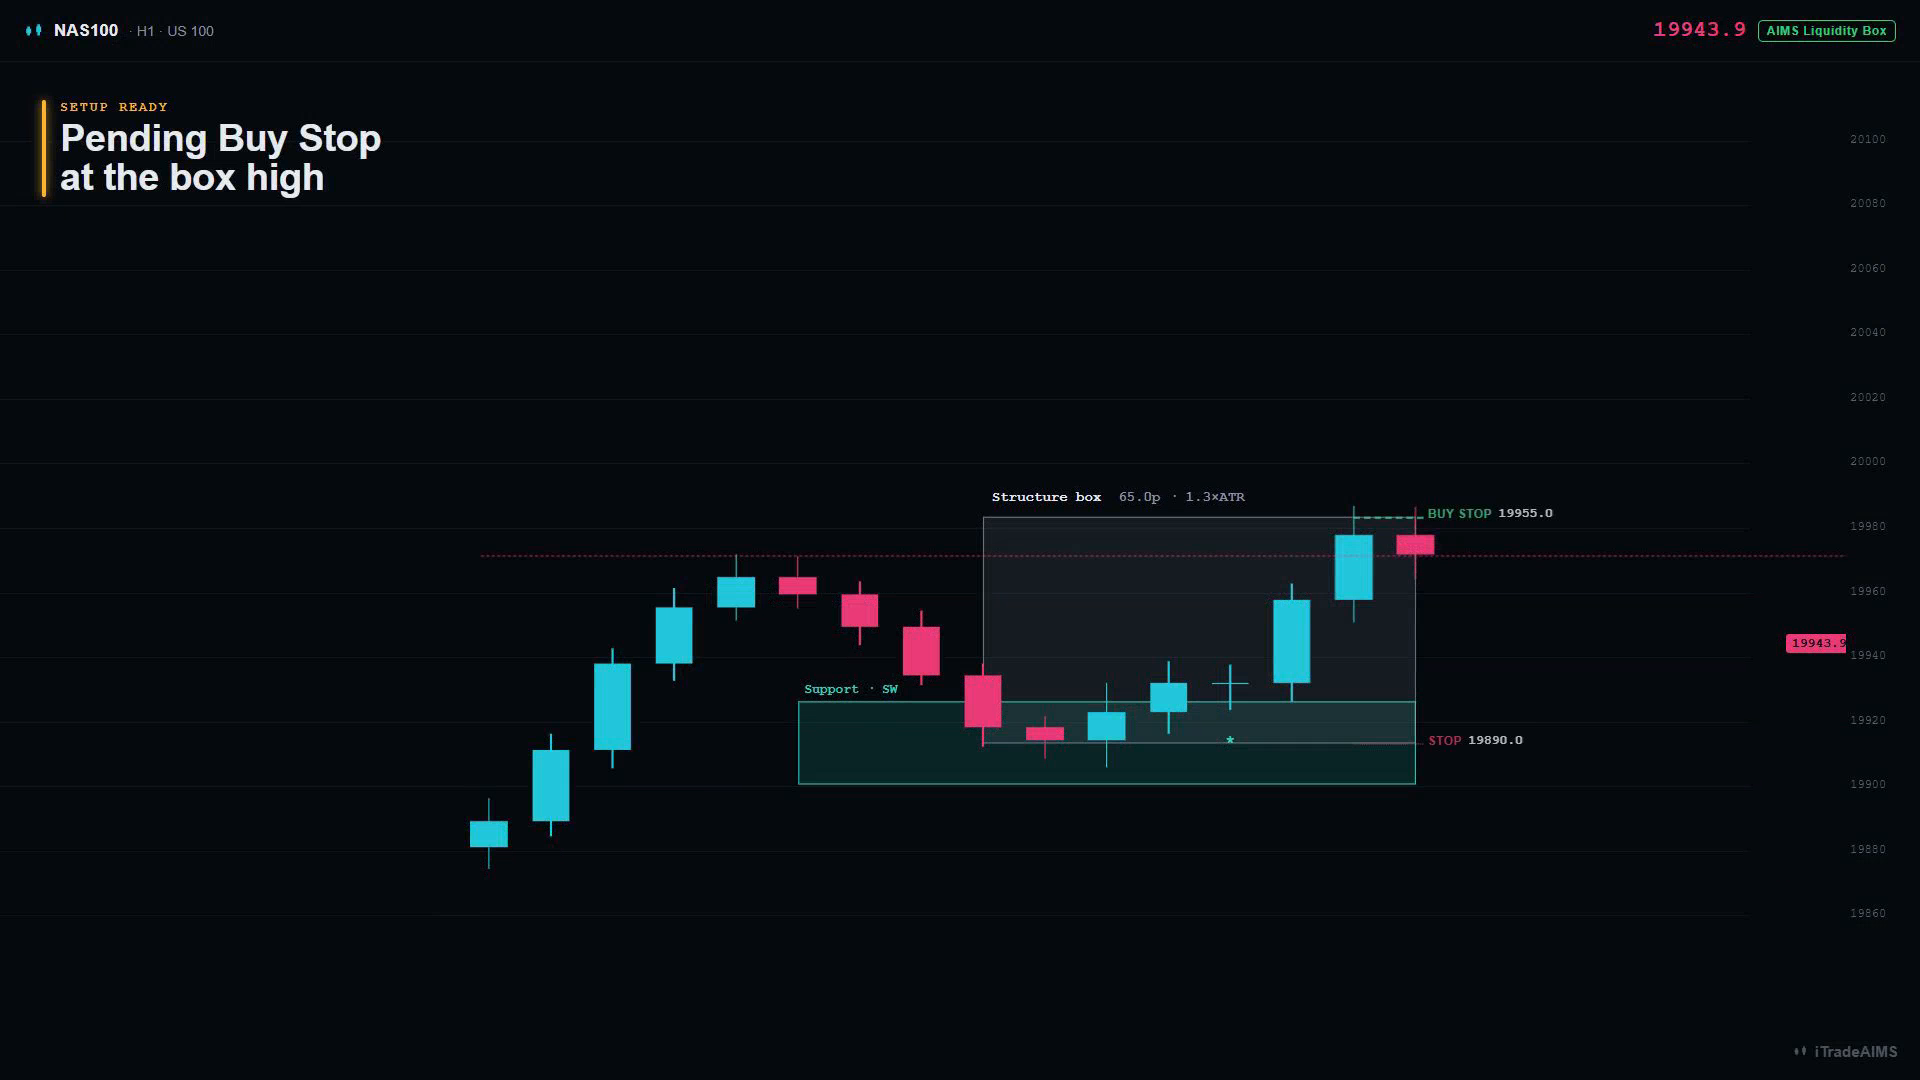
The Box family Setup Ready chart style looks like this on TradingView (structure edition; Liquidity Box adds S&R bands on top):
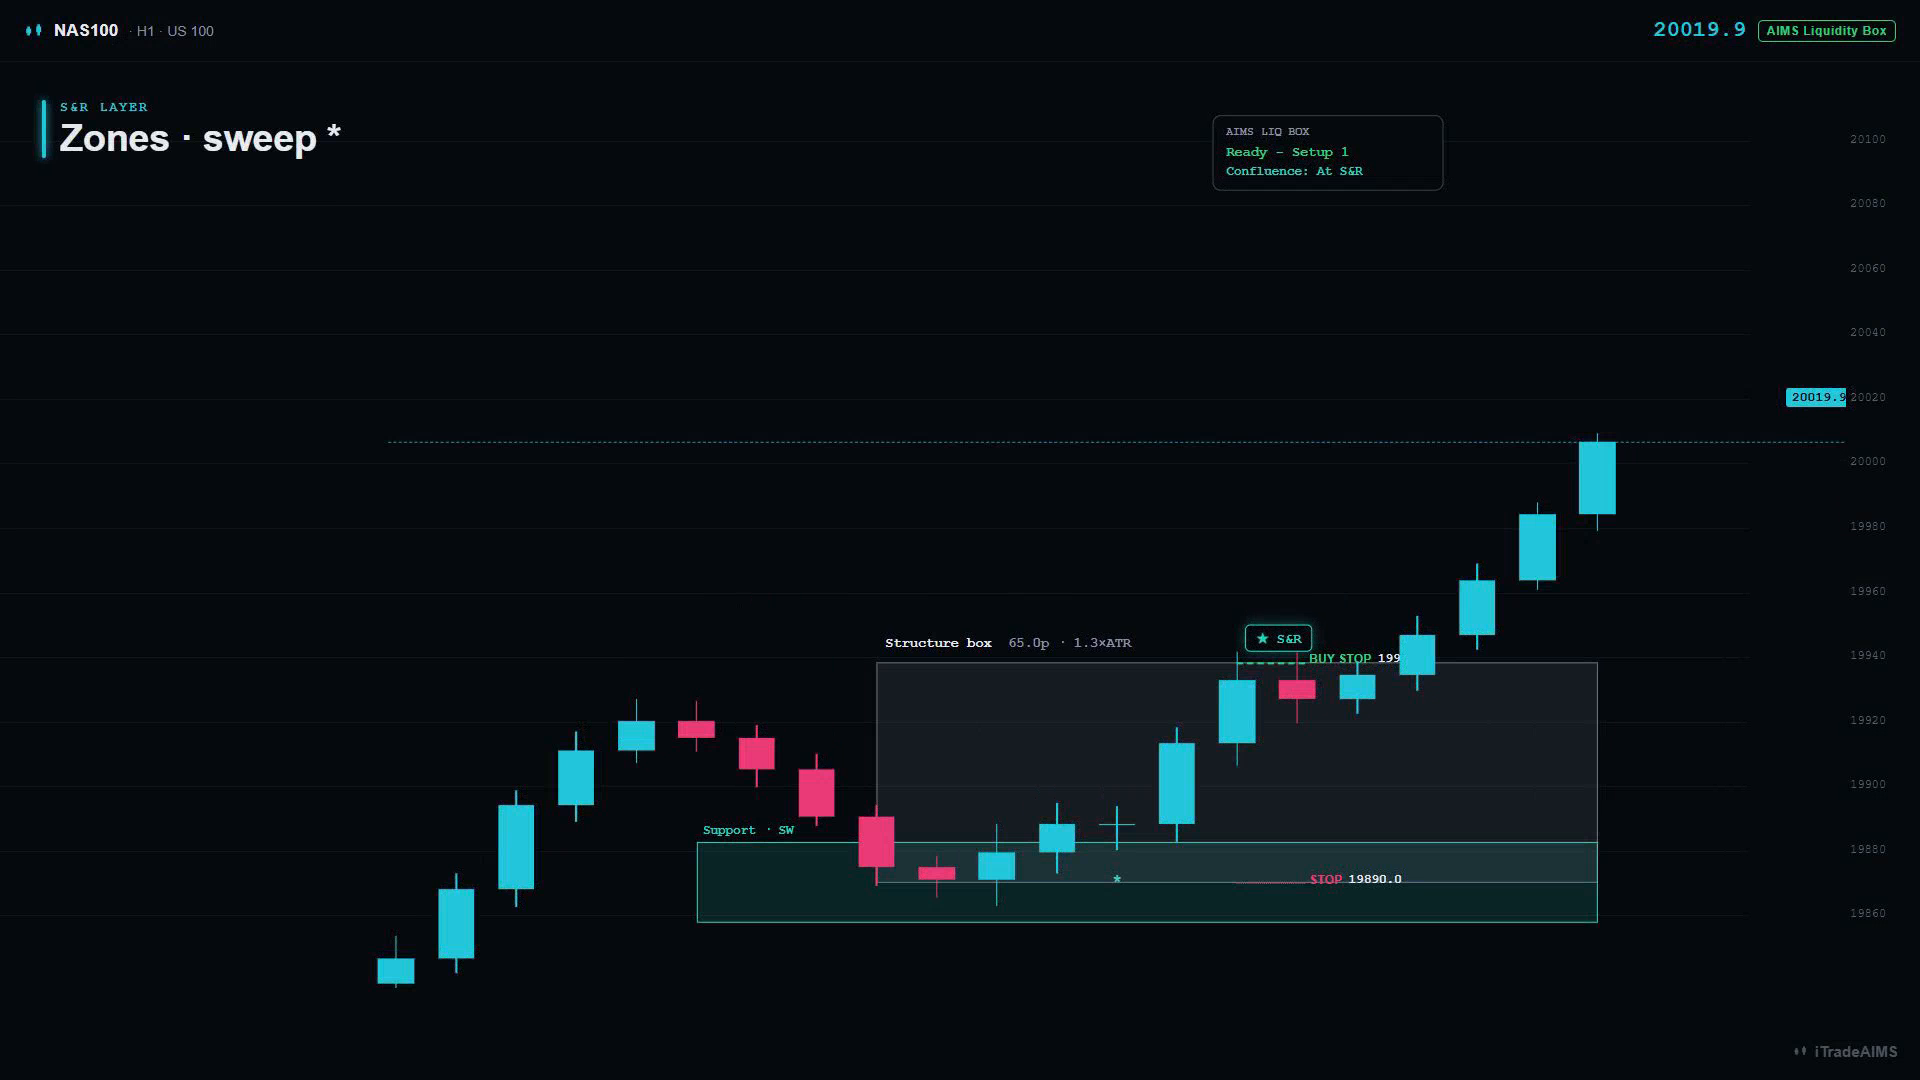
Support & Resistance
| On chart | Meaning |
|---|---|
| Teal / red zones | Support / resistance bands |
| Strength T / SW / D | Touches · Sweeps · Duration |
* | Liquidity sweep |
x | Level break (mitigated) |
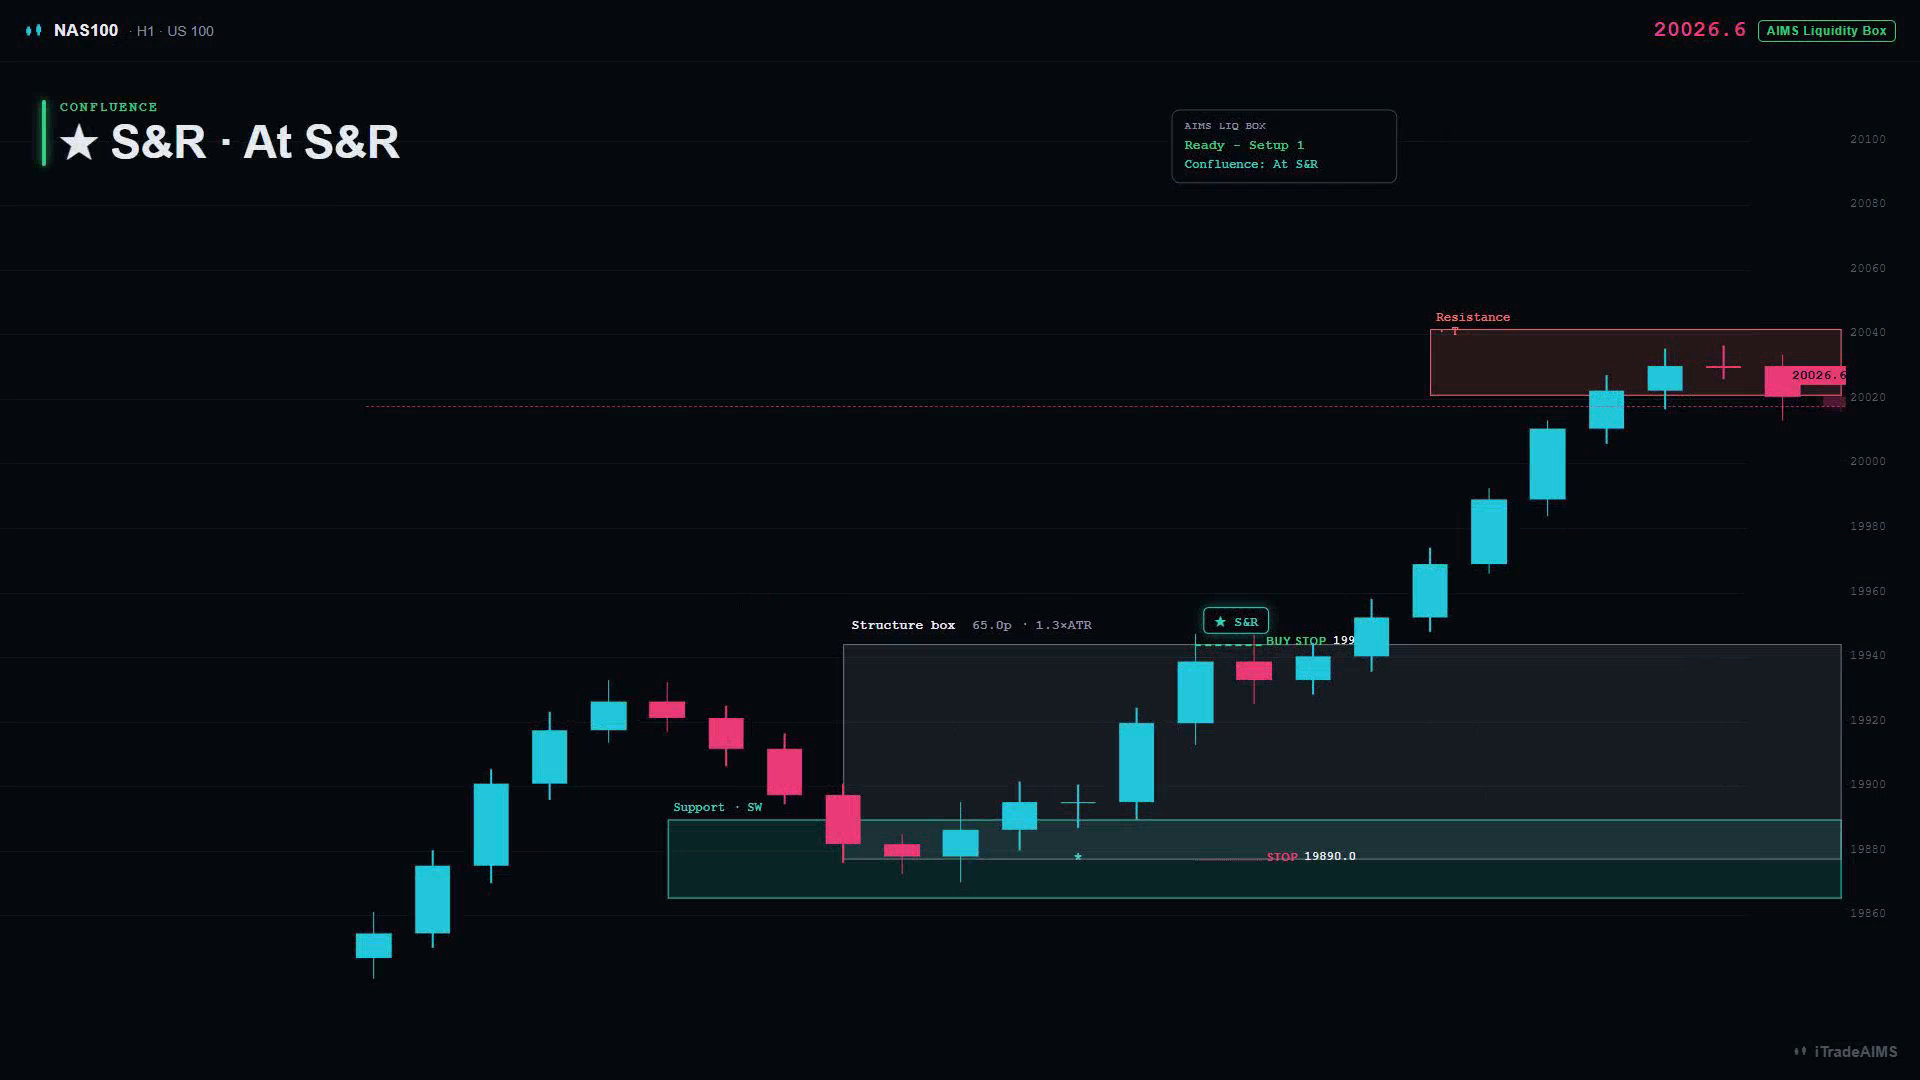
Confluence
| Flag | Meaning |
|---|---|
★ S&R on the setup | Entry edge aligns with S&R proximity or a fresh sweep |
| Dashboard Confluence: At S&R | Same idea in the panel |
| Confluence: No | Setup can still be Ready — just not at S&R |
Prefer reviewing At S&R setups in your first sessions. Leave Only arm setups near S&R off until you know how often setups appear on your symbol.
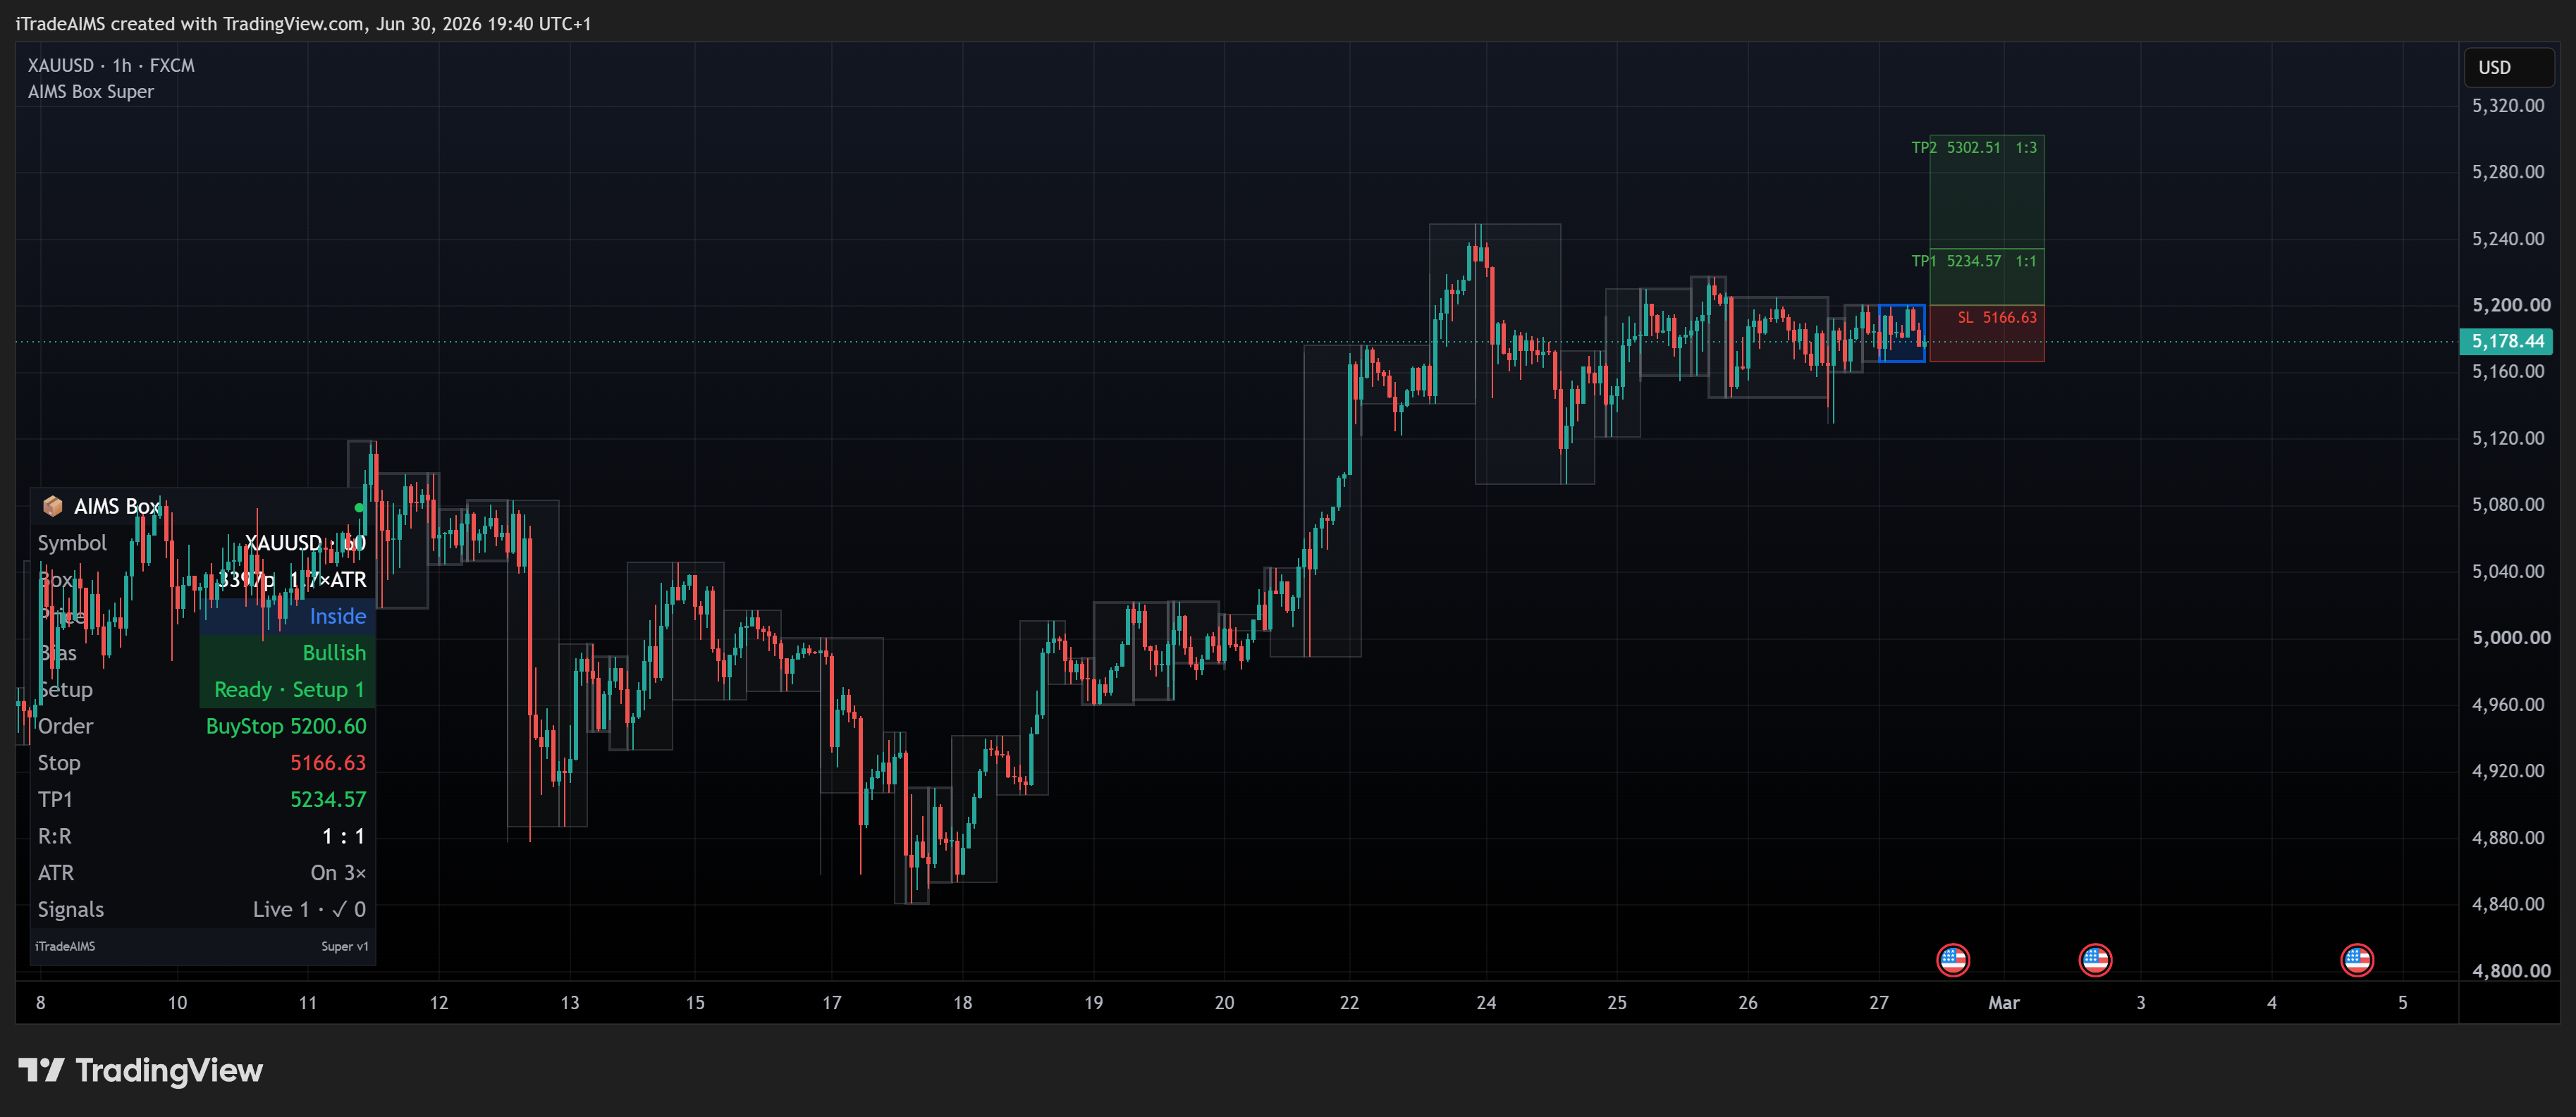
Dashboard rows to trust first
| Row | What to read |
|---|---|
| Box | Height in pips (and ×ATR when shown) |
| Price | Above / Inside / Below the box |
| Bias | Bullish / Bearish / Neutral (internal context) |
| Setup | Watching · Outside box · Too tall · Ready - Setup 1/2 |
| Order / Stop / TP1 / R:R | Pending levels when Ready |
| Confluence | At S&R or No when a setup is live |
| Support / Resistance | Distance in pips to nearest levels |
| S&R active / Sweeps | How busy the liquidity layer is |
4. Confirm it is working
Check all of the following:
- Chart legend shows AIMS Liquidity Box or AIMS Liq Box.
- Grey boxes appear after enough bars load.
- S&R zones appear (or you know you turned Show S&R zones off).
- Dashboard shows Symbol, Box, Price, Bias, and Setup.
- When Setup shows Ready, Order / Stop / TP1 populate.
- You did not expect Gator lines or candle colouring (this script does not draw them).
5. Optional next tweaks
Only after the chart reads correctly:
- Turn Only arm setups near S&R on if you want non-confluent setups suppressed.
- Reduce chart density: turn off strength labels, lower Max active levels, or set Keep signals to Current only.
- Create alerts — see Liquidity Box alerts.