Liquidity Box Settings
Open the gear on AIMS Liquidity Box → Inputs. Labels below match the script. If your build differs slightly, trust the names on the Inputs tab.
Leave defaults until you can read SETUP READY and At S&R. Change one group at a time after that.
Teaching charts below are illustrative (chart-anim engine). Live annotated Liquidity Box screenshots (inputs dialog, real TV OHLC) remain on the capture backlog.
1 · Box
| Input | Default | Plain meaning |
|---|---|---|
| Fractal bars | 5 | How many bars confirm a fractal high/low that seeds the box. Must be an odd number. Larger = fewer, bigger boxes. |
2 · Filters
| Input | Default | Plain meaning |
|---|---|---|
| ATR box-size filter | On | Oversized boxes can still draw, but they will not arm a setup. |
| ATR period | 20 | Lookback for that size check. |
| Max box xATR | 2.0 | Box taller than this ×ATR is treated as too large to arm. |
| Max box pips (0 = off) | 0 | Optional hard cap in pips after the ATR gate. |
When a box is too tall, the dashboard Setup row can show something like Too tall …x instead of Ready.
3 · Trade Levels
| Input | Default | Plain meaning |
|---|---|---|
| TP1 (x risk) | 1.0 | First target as a multiple of box height (entry → stop = 1R). |
| TP2 (x risk) | 2.0 | Second target on the same scale. |
| Show TP zones | On | Draw the green reward zones on the chart. |
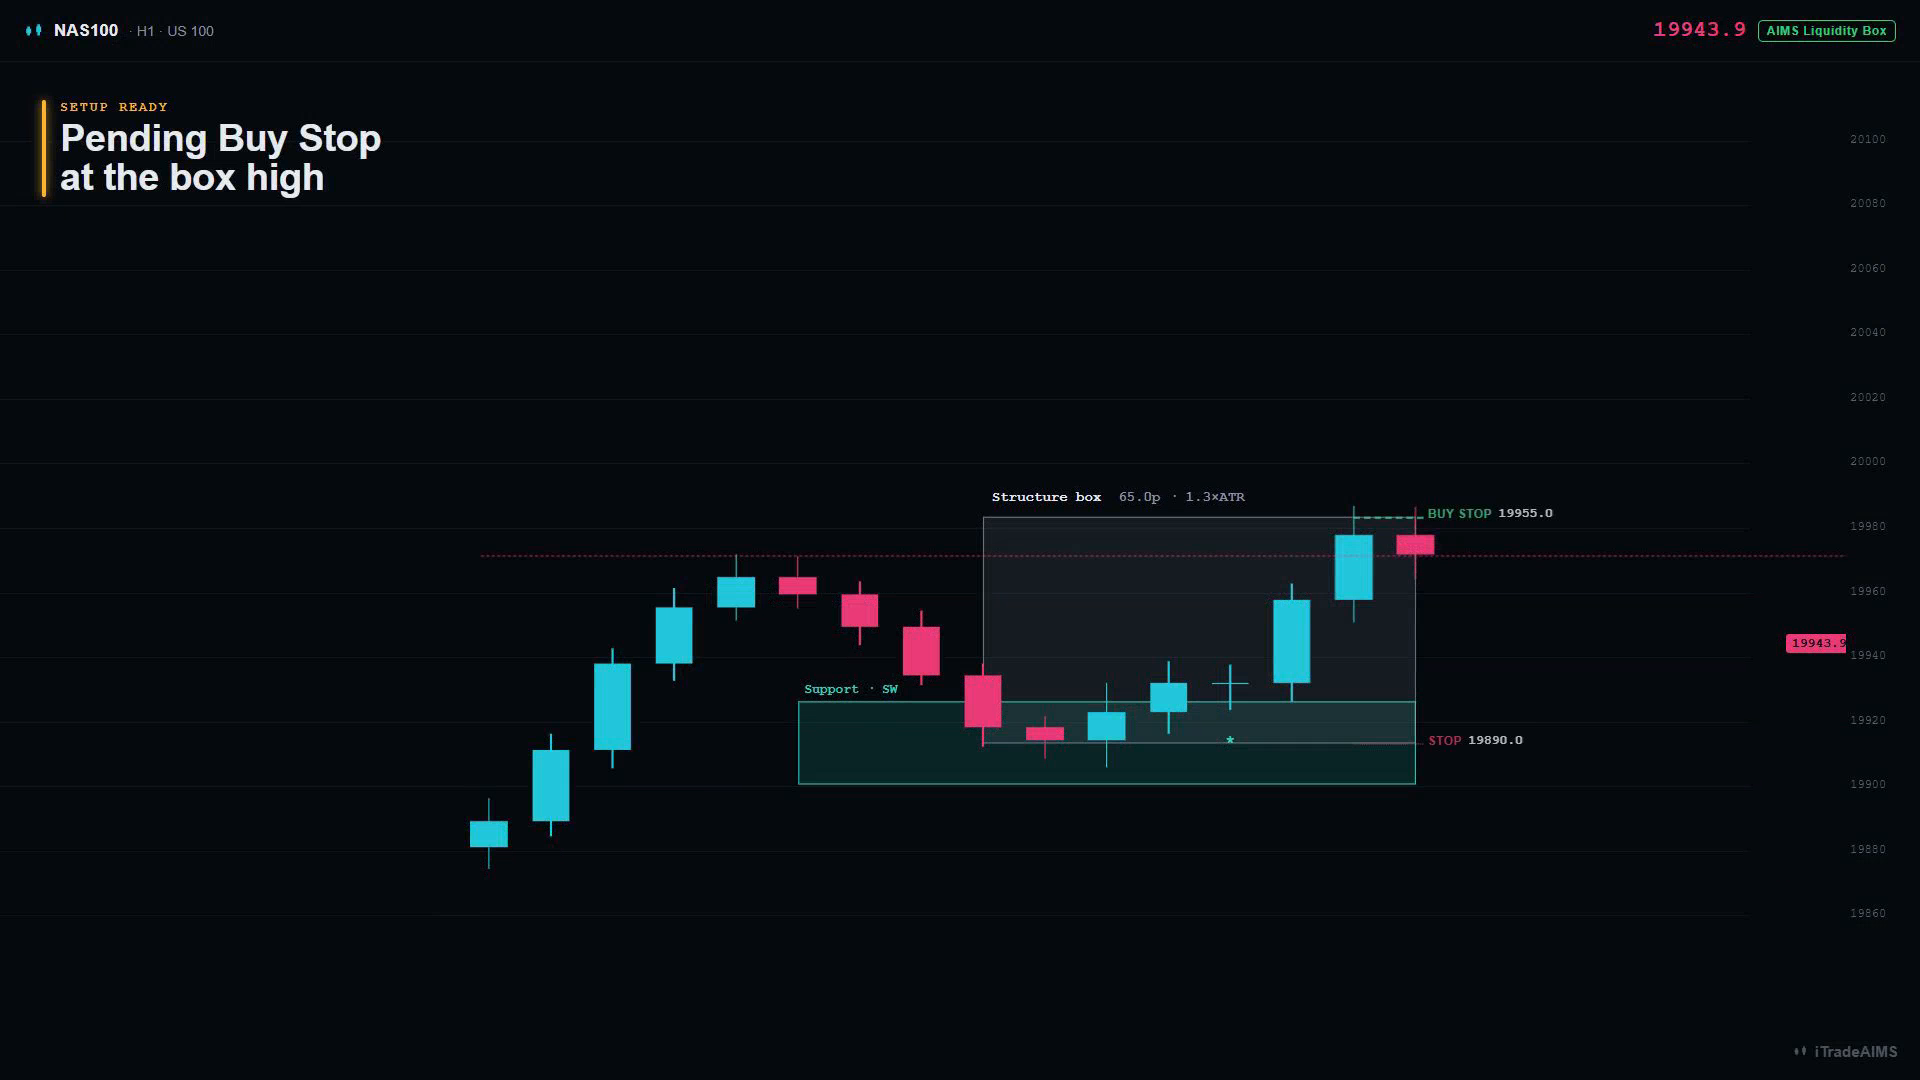
4 · Support & Resistance
This group is the liquidity layer (TradingView-only — not on MT5 Box yet).
| Input | Default | Plain meaning |
|---|---|---|
| Show S&R zones | On | Draw support / resistance bands. |
| Detection method | Donchian | How swings that seed levels are found: Pivots, Donchian, or ZigZag. |
| Swing sensitivity | 10 | For Pivots/Donchian this is a lookback; for ZigZag it is a % deviation. |
| Display | Zones | Zones (bands) or Levels (thinner lines). |
| Zone ATR period | 200 | ATR used to size zone depth. |
| Zone depth xATR | 0.5 | How thick each band is around the swing price. |
| Max active levels | 5 | Cap on how many live levels stay on screen. |
| Overlap | Hide older | When levels stack: None, Merge, or Hide older. |
| Show broken (mitigated) S&R | On | Keep levels that have already been broken. |
| Extend active S&R | On | Draw active levels forward in time. |
| Show level strength label | On | T = touches, SW = sweeps, D = duration (bars). Turn off for a cleaner chart. |
| Highlight sweeps | On | Mark liquidity grabs with *. |
| Highlight breaks | On | Mark closes through a level with x. |
| Min touches | 0 | Hide weak levels below this touch count. |
| Min sweeps | 0 | Hide levels below this sweep count. |
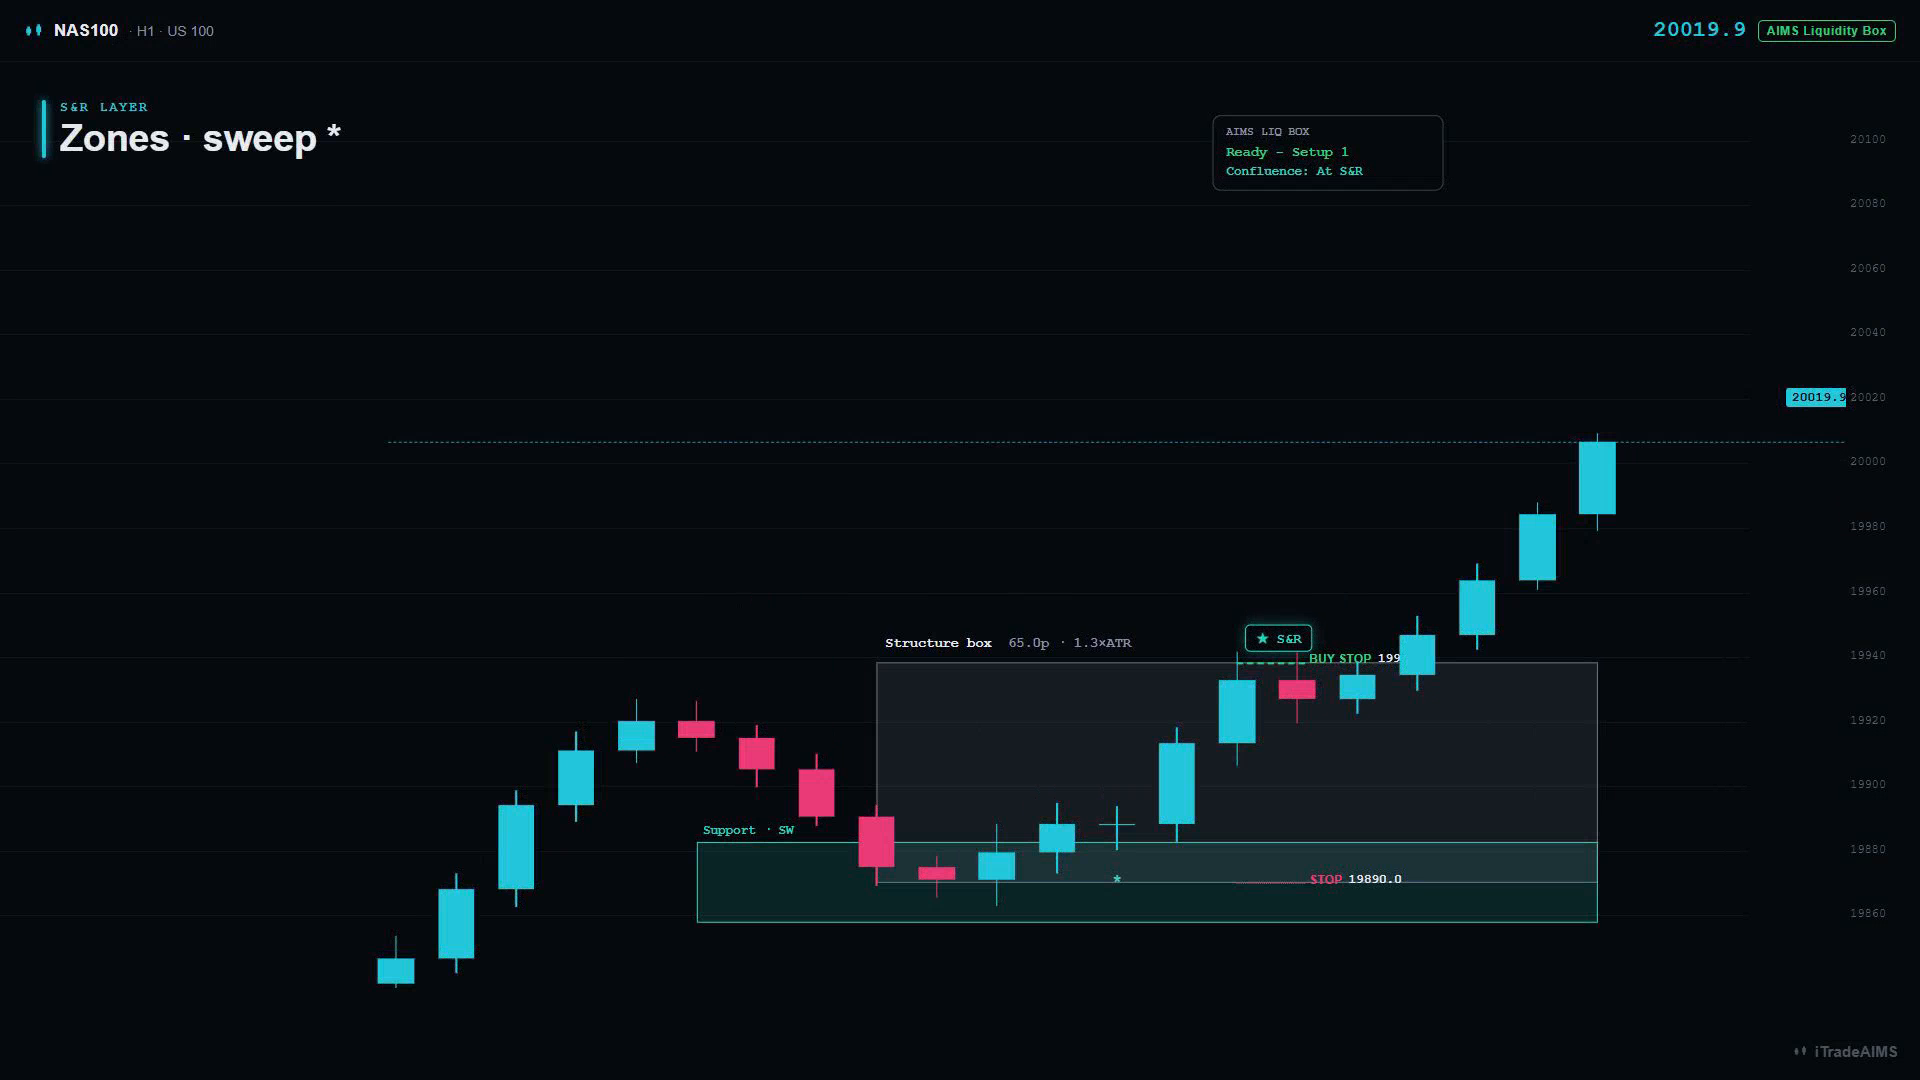
Beginner tip: on lower timeframes, sweeps can look busy. Raise Max active levels only if you need more context; more often you will lower density (fewer levels, strength labels off).
5 · Confluence
| Input | Default | Plain meaning |
|---|---|---|
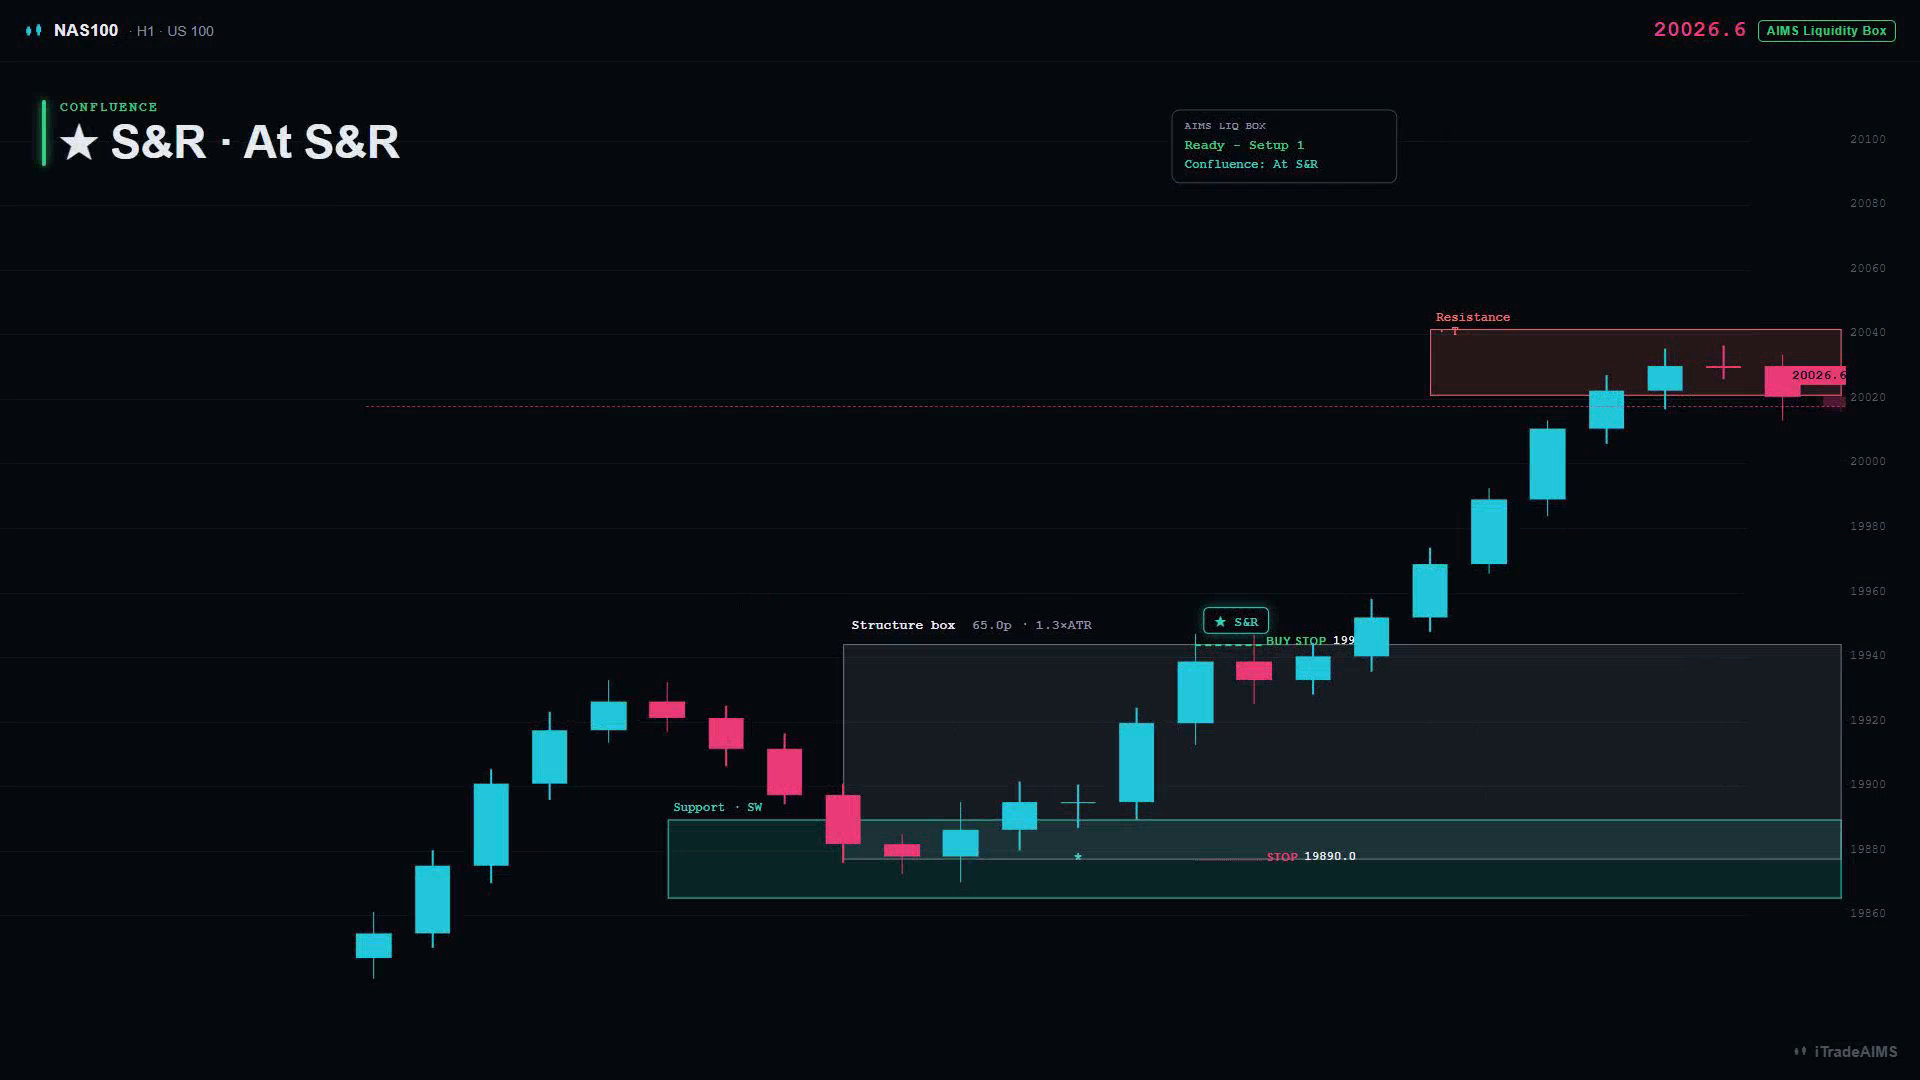
| Flag setups at S&R | On | Star a Ready setup when the entry is near an active S&R level or a fresh sweep (★ S&R / At S&R). |
| Proximity (xATR) | 0.5 | How close the entry must be to count as confluent. |
| Only arm setups near S&R | Off | On = non-confluent box setups are suppressed. Leave off until you understand setup frequency on your symbol. |
6 · Display
| Input | Default | Plain meaning |
|---|---|---|
| Show boxes | On | Draw structure boxes. |
| Show setup zones | On | Draw the pending entry / stop / TP picture. |
| Setup style | Zones | Zones, Lines, or Both. |
| Extend (bars) | 20 | How far setup drawings extend. |
| Live levels offset (bars) | 1 | Shifts the active pending levels a few bars right so they do not sit on the current candle. After trigger, levels freeze. |
| Keep signals | Last 3 | How many past setups stay visible: Current only, Last 3, Last 5, Session, or All. |
7 · Dashboard
| Input | Default | Plain meaning |
|---|---|---|
| Show dashboard | On | Live panel on the chart. |
| Position | Bottom Left | Corner / side placement. |
| Theme | Dark | Dark or Light. |
| Text size | Normal | Tiny through Large. |
Rows you will see most often
| Dashboard label | Meaning |
|---|---|
| Symbol | Ticker and timeframe |
| Box | Size in pips (and ×ATR when available) |
| Price | Above / Inside / Below the box |
| Bias | Bullish / Bearish / Neutral |
| Setup | Watching · Outside box · Too tall · Ready - Setup 1/2 |
| Order | BuyStop / SellStop @ price when Ready |
| Stop / TP1 / R:R | Risk and first target when Ready |
| Confluence | At S&R or No when a setup is live |
| Support / Resistance | Distance in pips to nearest levels |
| S&R active | Count of active support and resistance levels |
| Sweeps | Sweep count on the liquidity layer |
| Signals | Live vs triggered setup counts |
8 · Alerts / PineConnector
| Input | Default | Plain meaning |
|---|---|---|
| Enable alerts | On | Allow alert messages at SETUP READY. |
| PineConnector messages | Off | When on, alerts use pending-order style messages for PineConnector instead of plain text. |
| PineConnector License ID | placeholder | Your connector license ID when using PineConnector. |
| PineConnector Symbol | e.g. GER40 | Symbol string your connector expects. |
| Risk % | 1.0 | Reference risk for connector messages. The indicator itself does not size positions. |
How to create the alert in TradingView: Liquidity Box alerts.
Strategy companion
AIMS Liquidity Box (Strategy) shares the same engines for Strategy Tester practice. Use honest costs in TradingView. Historical results are not a promise of future performance.