AI Quant Market Radar & The PhD Mathematics Behind It
Most "AI trading tools" are just chat wrappers that send a text prompt to an external server and guess direction.
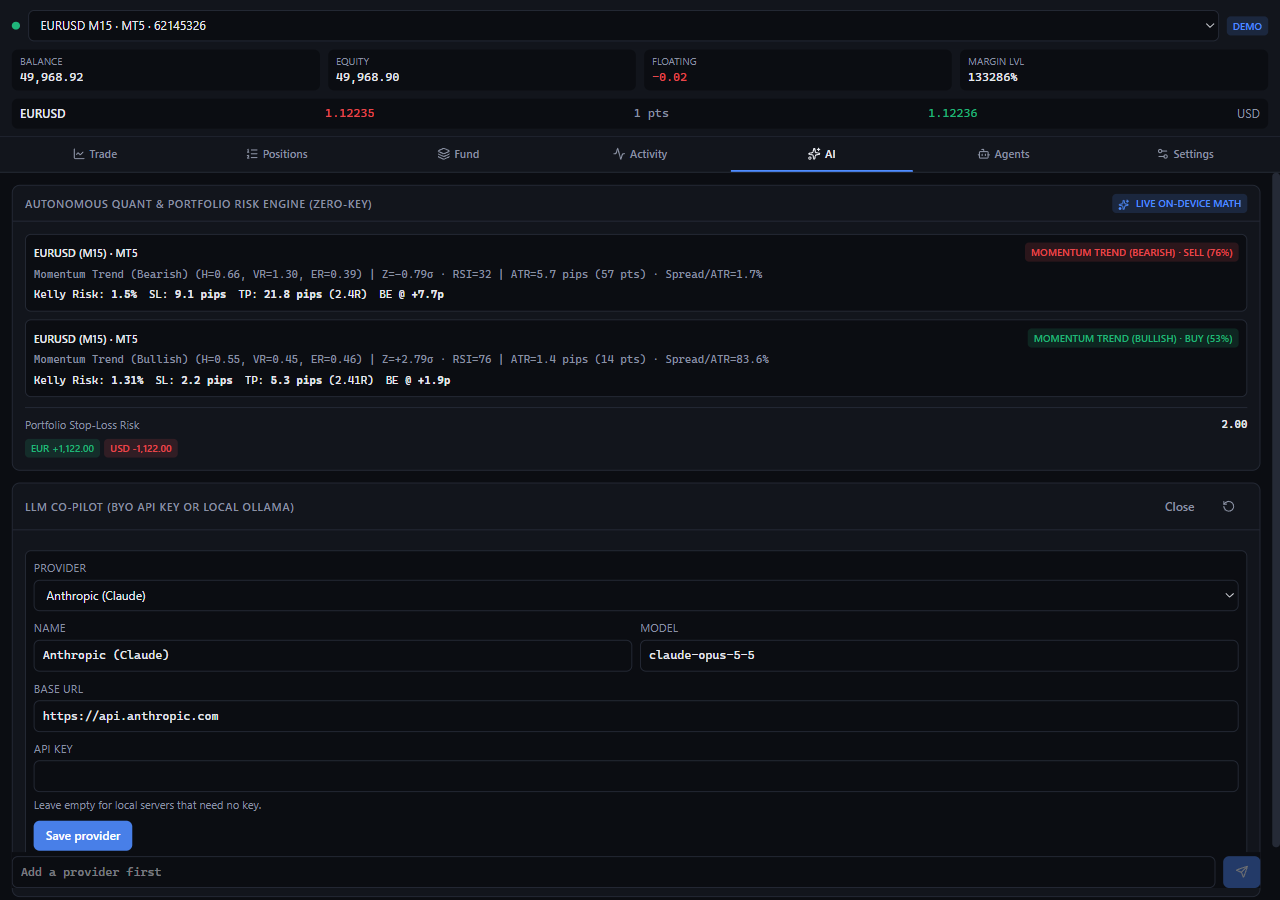
TM Pro's AI Quant Regime & Portfolio Risk Engine is fundamentally different:
- Every 5 seconds (and on every candle close), the TM Pro EA streams 120 closed OHLCV bars from your live MetaTrader chart directly into TM Pro's on-device quantitative engine.
- It runs 100% locally on your CPU in under 2 milliseconds—requiring zero cloud API keys, zero monthly token costs, and zero network latency.
Part 1: The Trader's 3-Second Playbook (Plain English)
You do not need a PhD in quantitative finance to trade with the AI Quant Radar. Every calculation is distilled into one color-coded Regime Badge and one "Apply Setup" button on your Trade tab:
How to Trade Each of the 4 Regime Badges
| Regime Badge | When It Appears | How to Trade It Effectively |
|---|---|---|
TREND BULL · BUY (Green) | Hurst H > 0.55 and positive directional efficiency | Institutional order-flow is persistent upward. Focus on long pullbacks and breakouts. Use a wider 3.2x ATR Take Profit and enable Trailing Stop so you don't cap big trend runners. |
TREND BEAR · SELL (Red) | Hurst H > 0.55 and negative directional efficiency | Institutional order-flow is persistent downward. Focus on short pullbacks and breakdowns. Let the EA trail your stop behind lower highs. |
MEAN REVERT (Amber) | Hurst H < 0.45 or price is stretched (` | Z |
HIGH VOL CHOP · NEUTRAL (Muted/Warning) | Hurst H ~ 0.50 (random walk) or extreme volatility spike | Price action has no statistical memory (50/50 coin-flip noise). Best action: sit on your hands or let Apply Setup cut your risk down to a defensive 0.25%. |
What Clicking "Apply Setup" Does Automatically
Inside the AI Quant Regime & Alpha Radar card on the Trade tab, clicking Apply Setup transfers five volatility-calibrated parameters into your Order Ticket in a single click:
- Risk
%: Set to the Quarter-Kelly Optimal fraction (0.25%to2.00%) based on current regime edge quality. - Stop Loss (
pips): Calibrated to1.5x ATRin trends (or1.8x ATRin mean-reversion) so normal candle noise doesn't prematurely stop you out. - Take Profit (
pips): Calibrated to3.2x ATRin persistent trends (or2.0x ATRin ranges). - Break-Even Trigger (
pips): Enabled at1.0x ATRin profit. - Trailing Stop (
pips): Enabled at1.2x ATRbehind peak price.
As soon as you click Apply Setup, look right above your cursor at the top SELL / BUY buttons—your new lot size, SL / TP prices, and exact dollar risk are already updated and ready to arm!
Part 2: The Institutional PhD Mathematics Under the Hood
For systematic traders, quants, and fund managers who want to inspect the exact stochastic calculus driving TM Pro's telemetry, here are the five estimators running on every 120-bar window (N = 120):
1. Rescaled-Range (R/S) Hurst Exponent (H)
Proposed by Harold Edwin Hurst and popularized in financial fractals by Benoit Mandelbrot, the Hurst Exponent measures the long-term memory of log-returns across multiple lag windows n in {8, 16, 32, 64}:
Log-Returns:           r_t = ln(Close_t / Close_{t-1})
Mean-Adjusted Series:  Y_k = sum_{i=1..k} (r_i - mean(r))
Cumulative Range:      R(n) = max_{1<=k<=n}(Y_k) - min_{1<=k<=n}(Y_k)
Sample Std Deviation:  S(n) = sqrt( (1/n) * sum_{i=1..n} (r_i - mean(r))^2 )
Scaling Power Law:     E[ R(n) / S(n) ] = C * n^H
OLS Log-Log Slope:     H = Cov( ln(n), ln(R(n)/S(n)) ) / Var( ln(n) )
H = 0.50: Geometric Brownian Motion (memoryless random walk).H in (0.55, 1.00): Persistent Fractal Process—positive autocorrelation where trending moves statistically follow trending moves.H in (0.00, 0.45): Anti-Persistent (Mean-Reverting) Process—negative autocorrelation where up-bars are statistically followed by down-bars.
2. Yang-Zhang Minimum-Variance OHLC Volatility (sigma_YZ)
Standard close-to-close volatility ignores intrabar highs/lows and overnight opening gaps. TM Pro implements Yang & Zhang's (2000) unbiased, minimum-variance estimator, which combines overnight jump variance (sigma_o^2), open-to-close drift variance (sigma_c^2), and Rogers-Satchell intrabar extreme variance (sigma_RS^2):
Overnight Log-Jump:    o_i = ln(Open_i / Close_{i-1})
Open-to-Close Drift:   c_i = ln(Close_i / Open_i)
Rogers-Satchell Term:  rs_i = ln(High_i / Close_i)*ln(High_i / Open_i) + ln(Low_i / Close_i)*ln(Low_i / Open_i)

Optimal Weighting:     k = 0.34 / ( 1.34 + (N + 1) / (N - 1) )
Per-Bar YZ Variance:   sigma_YZ^2 = Var(o) + k * Var(c) + (1 - k) * Mean(rs)
Annualized Vol (%):    Vol_Annual = sqrt( sigma_YZ^2 * BarsPerYear ) * 100
This makes TM Pro's volatility reading up to 14x more statistically efficient than standard close-to-close standard deviation on small sample windows.
3. Kaufman Efficiency Ratio (ER), Wilder ATR & Z-Score Stretch (Z)
To measure directional signal-to-noise alongside mean-reversion stretch over a 20-bar lookback (L = 20):
True Range (TR_t):     max( High_t - Low_t, |High_t - Close_{t-1}|, |Low_t - Close_{t-1}| )
ATR (14-bar):          (1 / 14) * sum_{t=N-13..N} TR_t   (converted to Pips)
Efficiency Ratio (ER): (Close_N - Close_{N-20}) / sum_{t=N-19..N} |Close_t - Close_{t-1}|   in [-1, +1]
Z-Score Stretch (Z):   (Close_N - SMA_20) / StdDev_20
- When
|ER| > 0.35andH > 0.55, directional trend velocity is clean and low-noise. - When
|Z| > 2.0, price is stretched more than 2 standard deviations from its 20-bar equilibrium—warning trend traders not to chase late entries.
4. Fractional Quarter-Kelly Optimal Sizing (f*)
The classic Kelly Criterion (John L. Kelly Jr., 1956; Edward O. Thorp) maximizes the expected geometric growth rate of capital E[ln(1 + f * R)]. Because full Kelly exhibits high drawdown variance under parameter estimation error, institutional quant desks use Fractional Quarter-Kelly (0.25 * f_full):
Estimated Win Prob:    p = clamp( 0.50 + 0.18 * Confidence * |ER|, 0.42, 0.68 )
Loss Probability:      q = 1 - p
Payoff Odds Ratio:     b = Suggested_TP_Pips / Suggested_SL_Pips
Full Kelly Fraction:   f_full = (p * b - q) / b
Quarter-Kelly Risk %:  f* = clamp( 0.25 * f_full * 100, 0.25%, 2.00% )
5. Portfolio 95% 1-Day Parametric Value-at-Risk (VaR_95) & Stop-Locked Risk Audit
In the AI tab under Portfolio Risk Audit, TM Pro continuously evaluates all open positions on your account against two institutional risk metrics:
1. Stop-Locked Cash Risk ($):
   Sum across all open positions of: |OpenPrice - StopLoss| * TickValue * Lots
   (Flags any unprotected position with StopLoss == 0 immediately in amber/red)

2. 95% 1-Day Parametric VaR ($):
   DailySigma   = (Vol_Annual / 100) / sqrt(252)
   VaR_95_1Day  = 1.64485 * DailySigma * GrossNotionalExposureUSD
This tells you—in real dollars—the maximum 1-day statistical loss expected on 95% of trading days given current market volatility, alongside your hard stop-loss floor.