Strategy Tester Results
Use this page after Quick start on TradingView when you want to interpret AIMS Algo backtests in TradingView.
Past performance
Strategy Tester output is historical simulation on TradingView's data model. Slippage, spreads, fills, and live broker rules can differ. Not financial advice.
What to open
- Add AIMS Algo to your chart.
- Open Strategy Tester at the bottom of TradingView.
- Select a symbol and timeframe you actually trade or research.
- Set a date range (multi-year windows help regime context; shorter windows help recent behaviour).
- Review Overview, Return details, Trades analysis, and Equity run-ups and drawdowns.
Example backtest snapshots
Owner-reviewed captures below. Your results will differ by symbol, timeframe, inputs, and TradingView data.
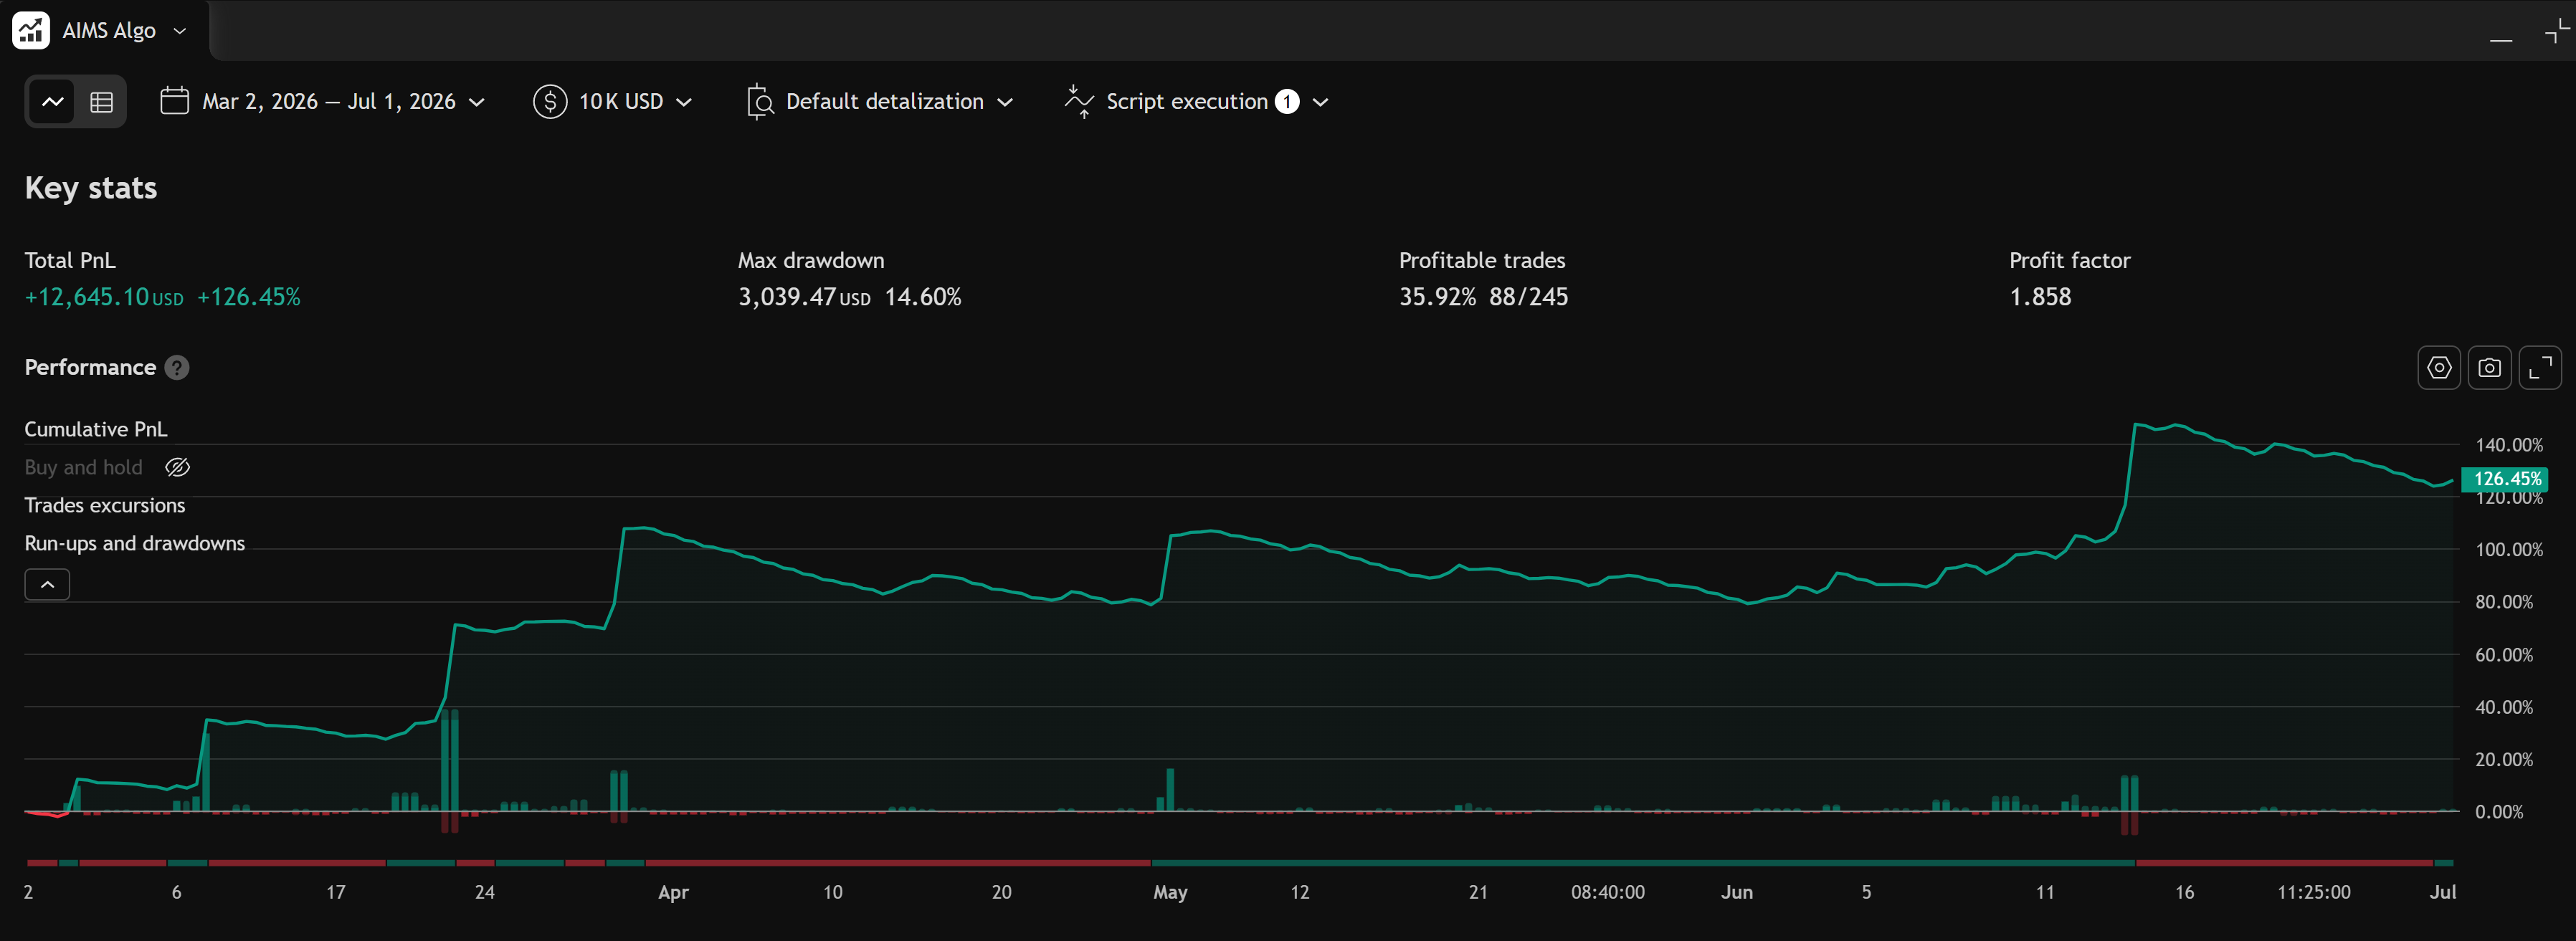
Recent window (Mar–Jul 2026)
Example — March 2, 2026 through July 1, 2026 on a NAS100 configuration with $10,000 initial capital.
Overview
Full report
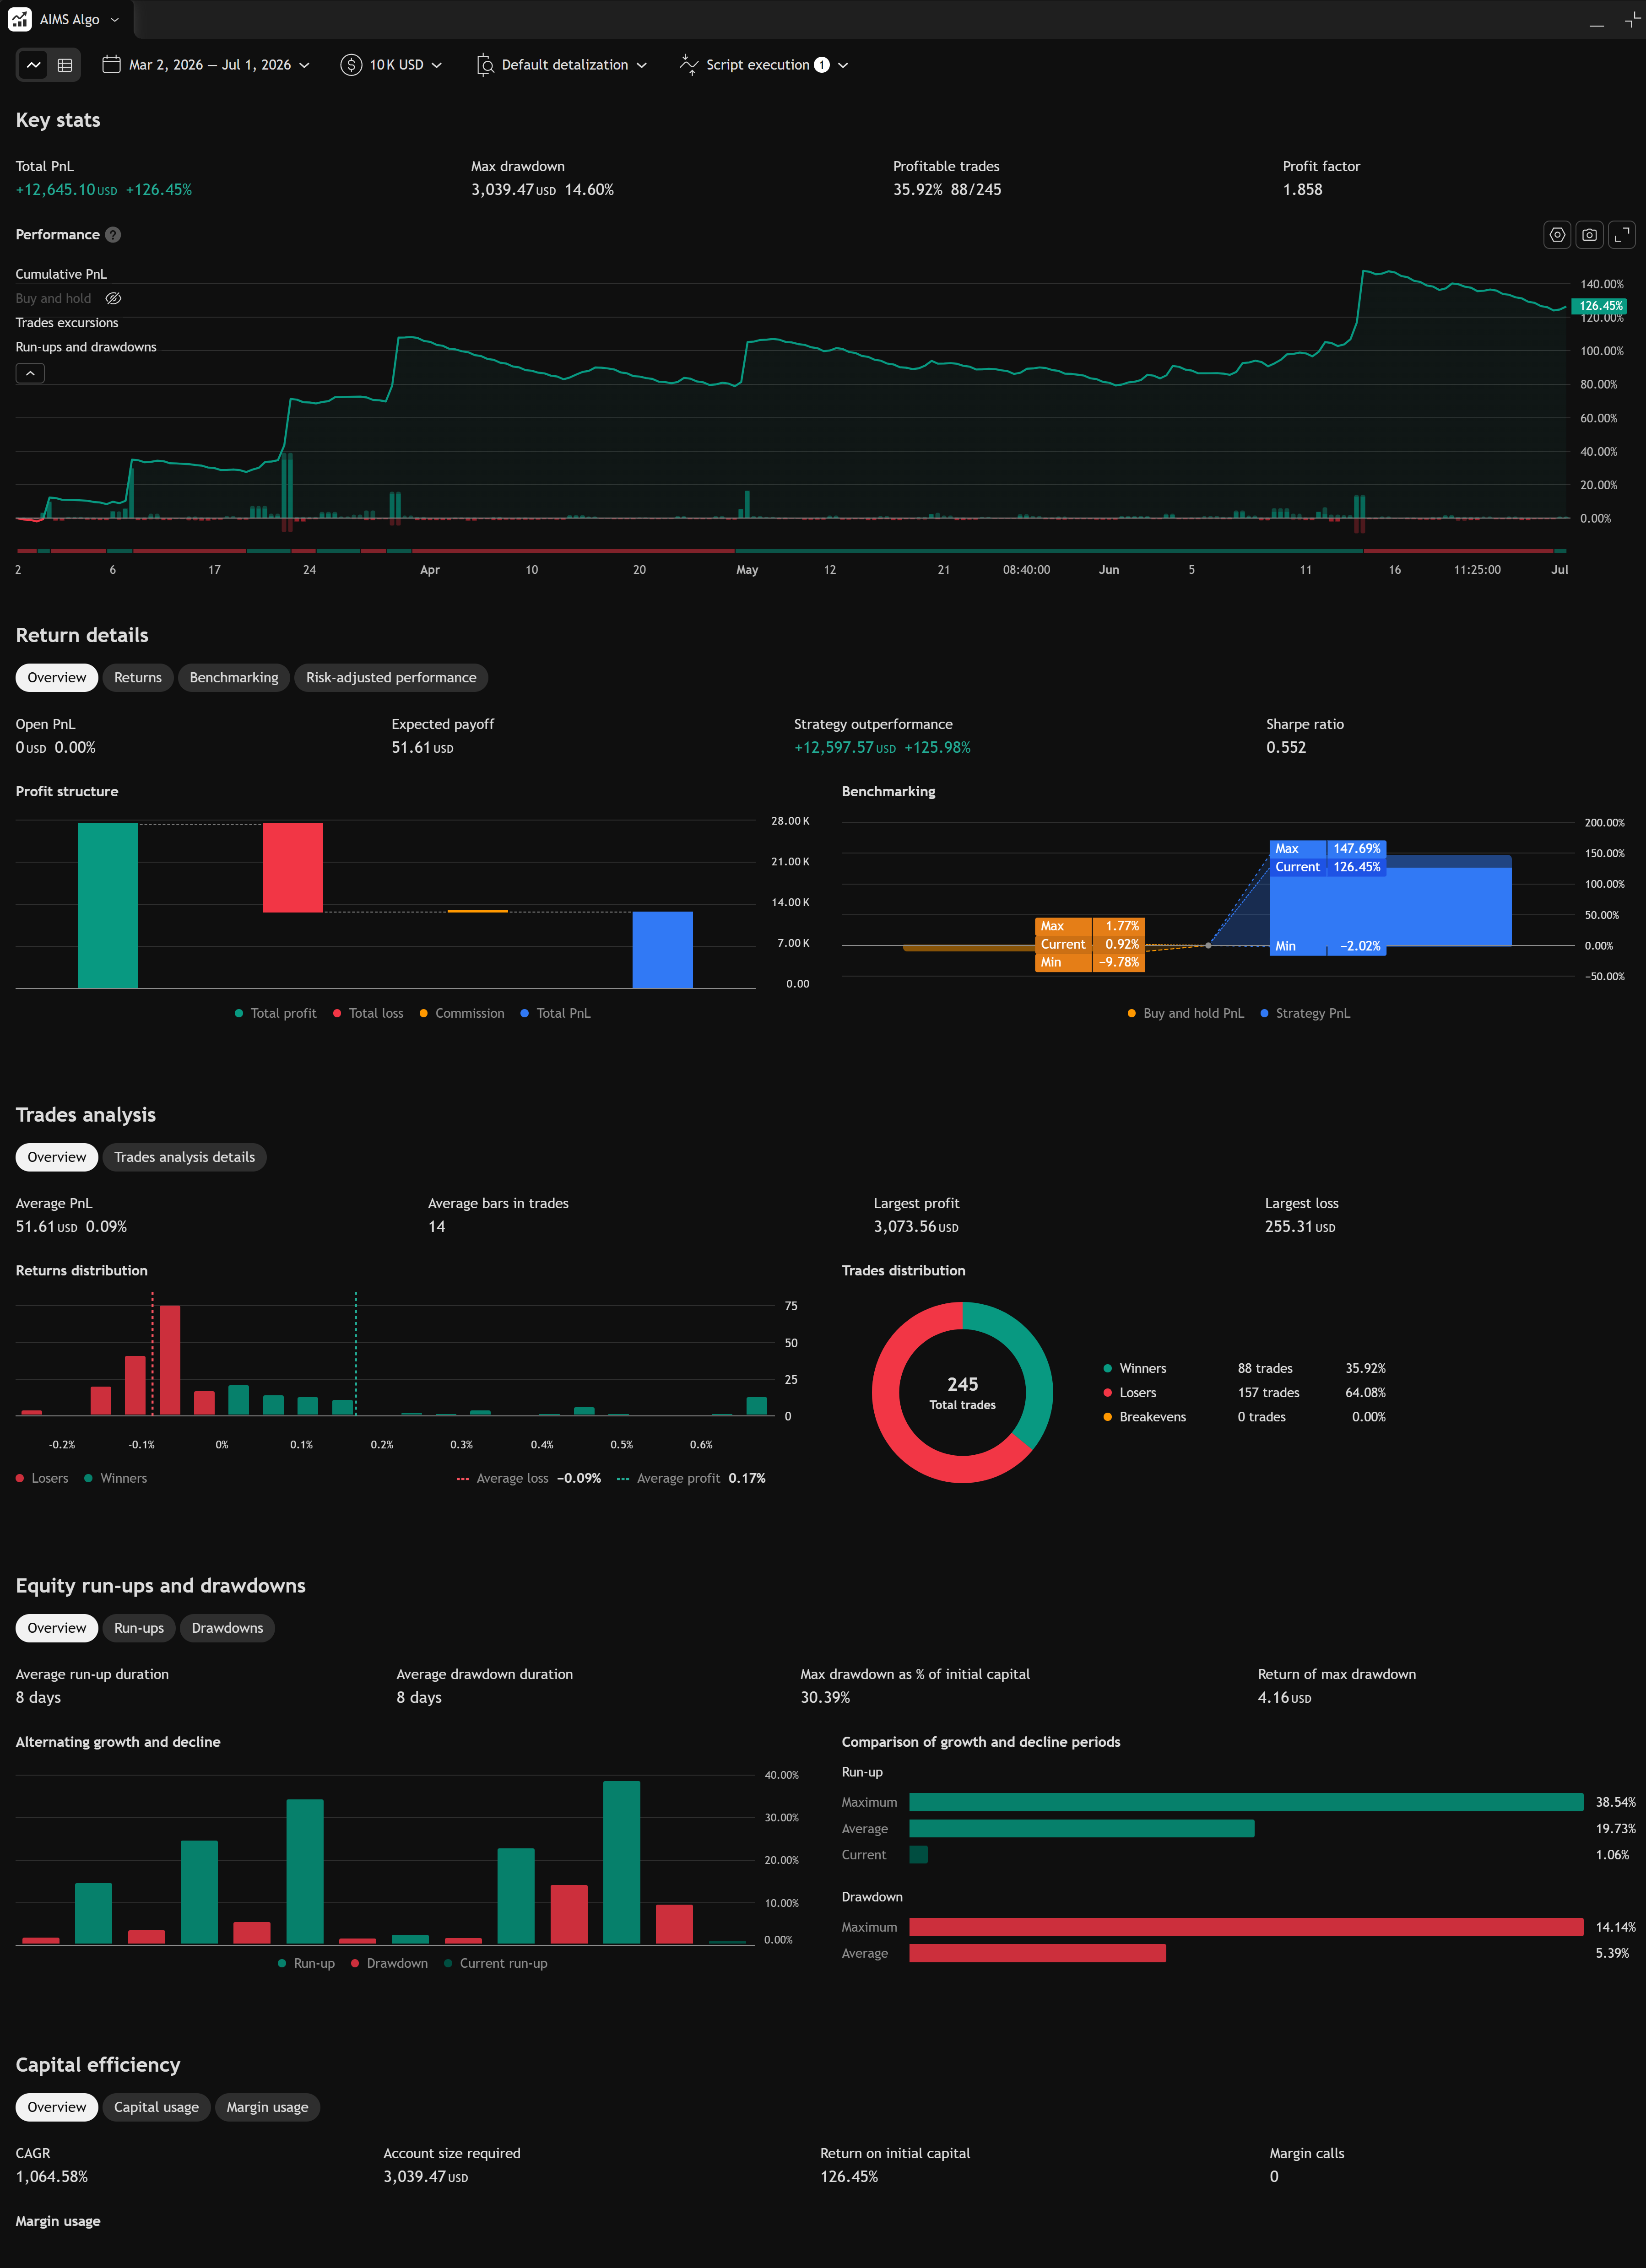
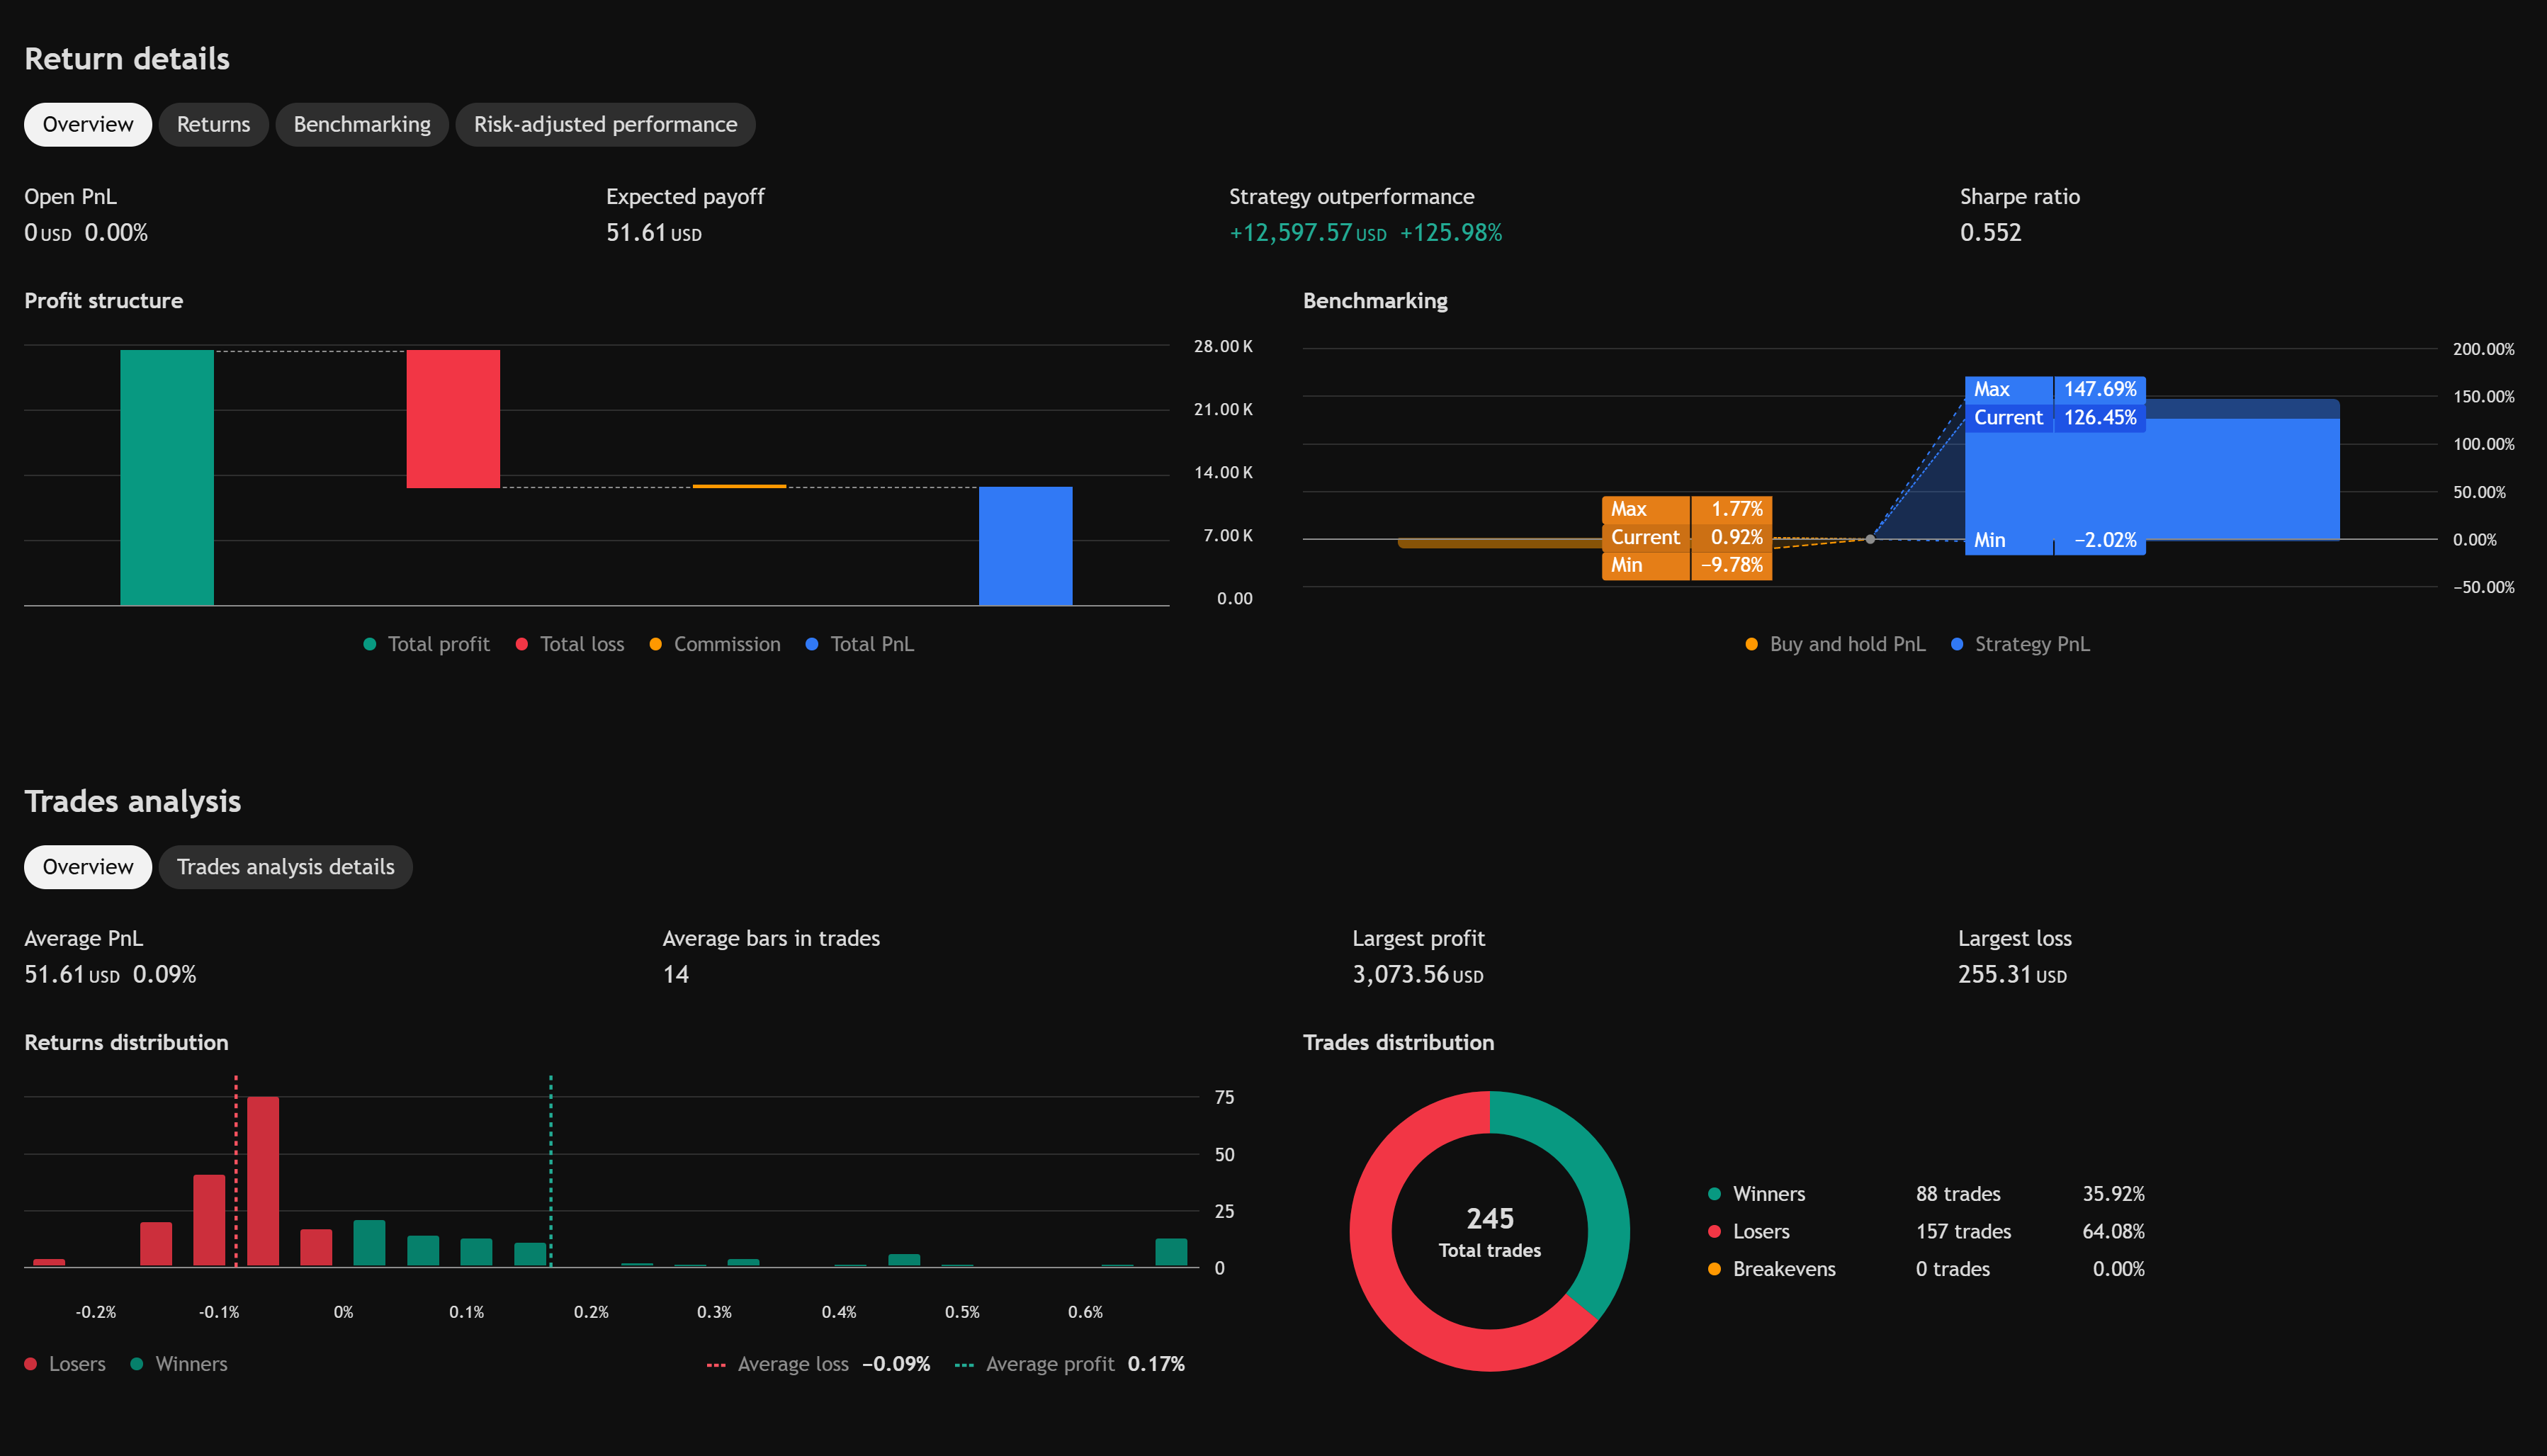
Return details and trades analysis
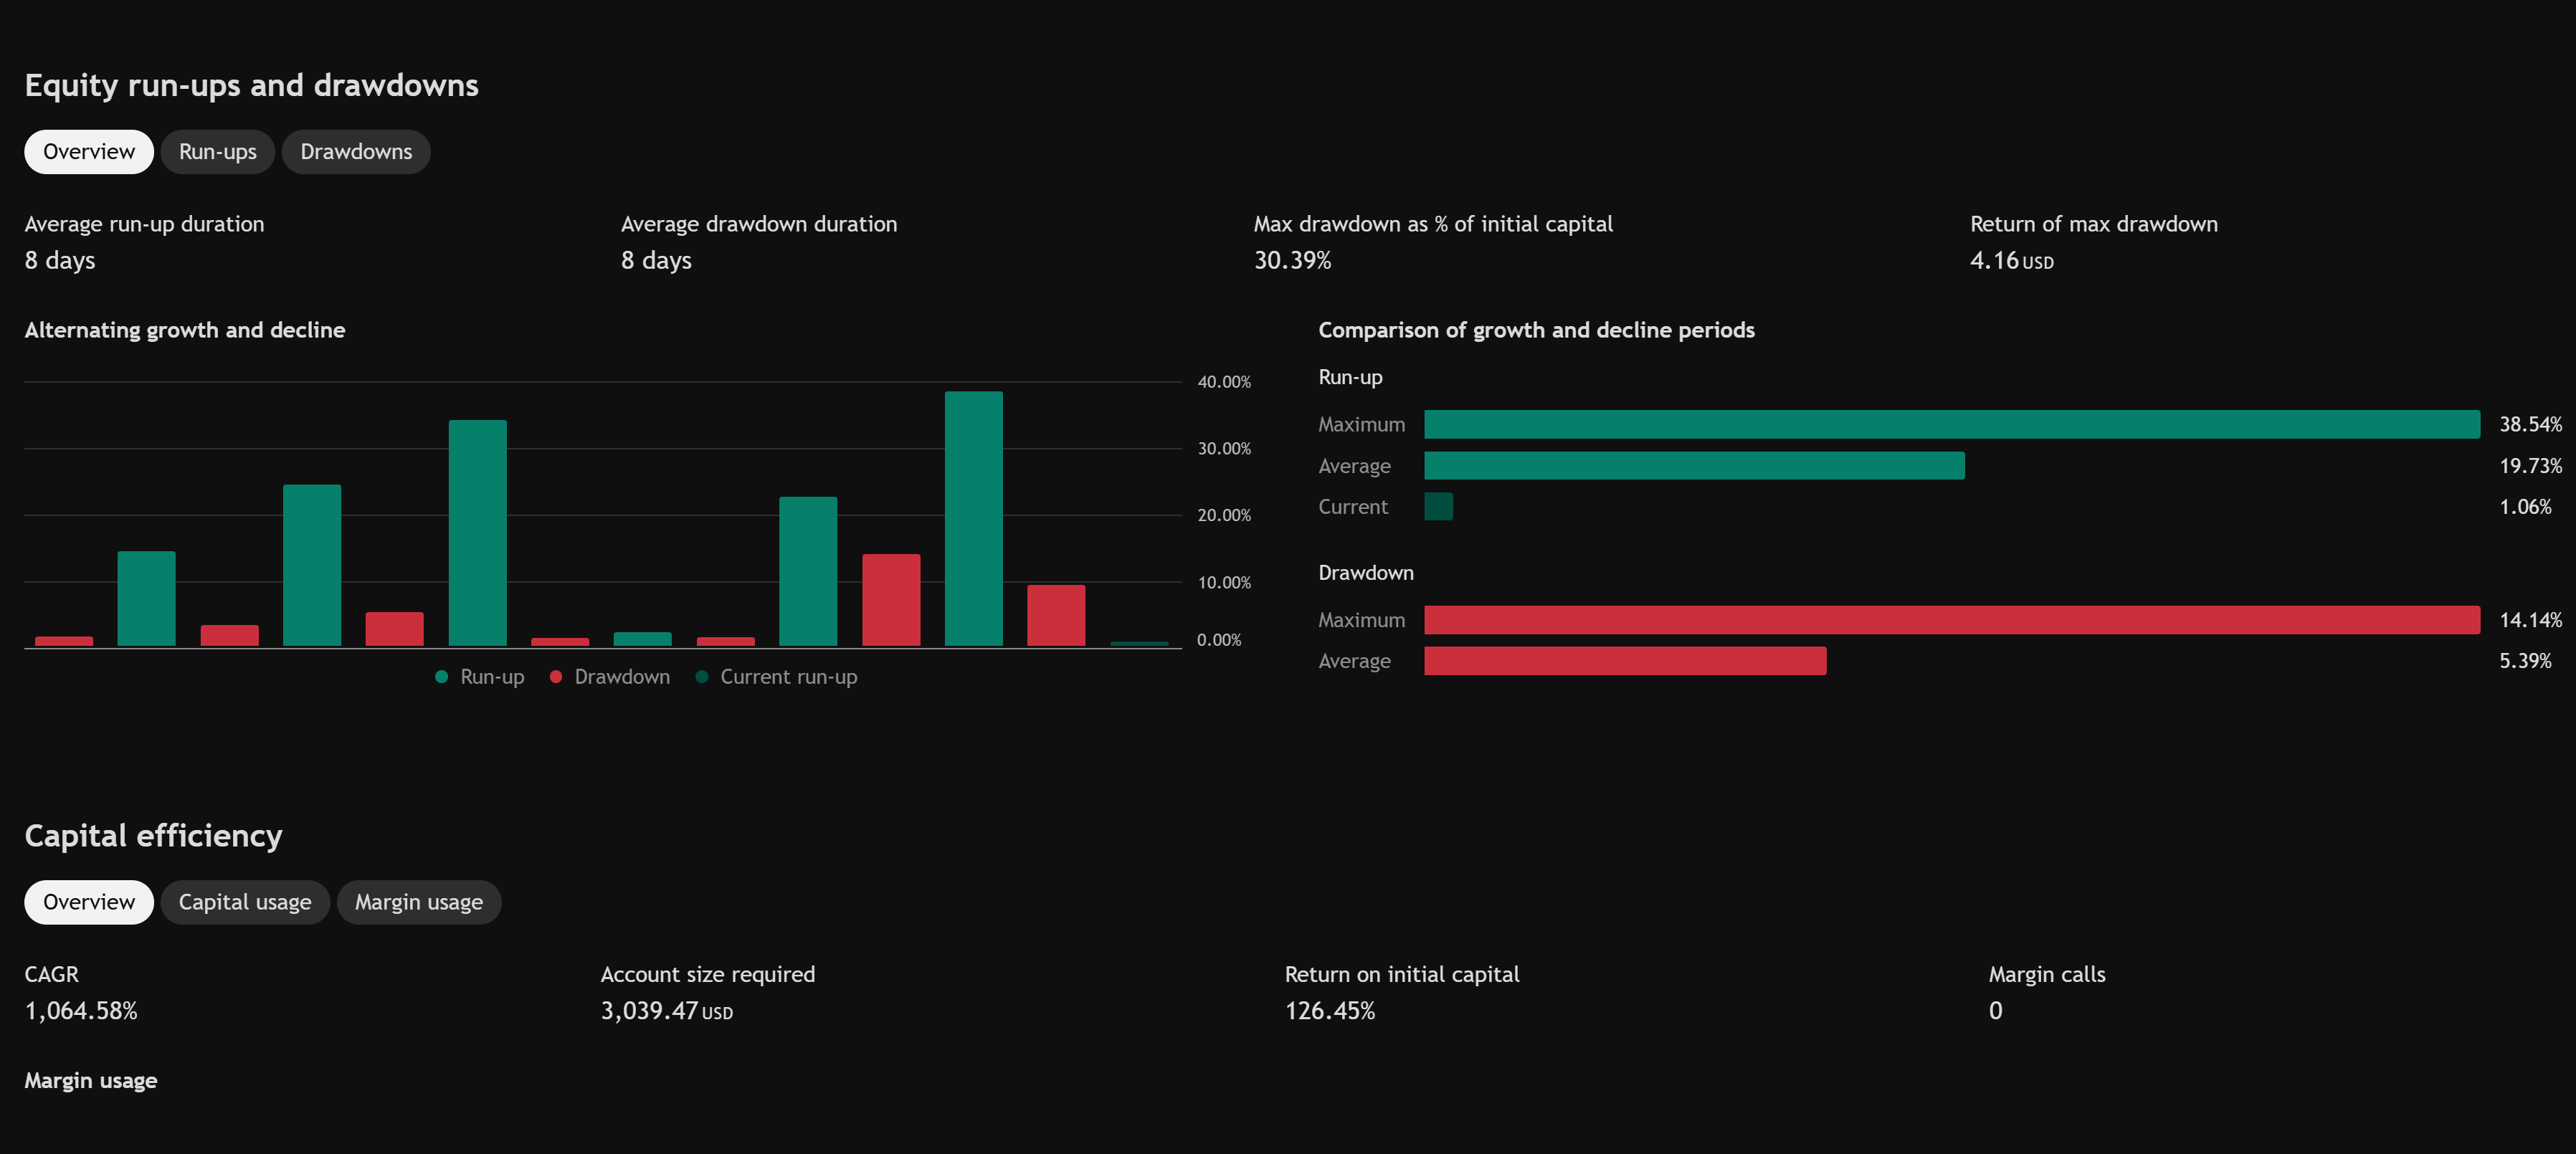
Equity run-ups and drawdowns
Long-window overlay (2014–2026)
Compact equity-curve read for multi-year context — useful on Get started and What is AIMS Algo?.
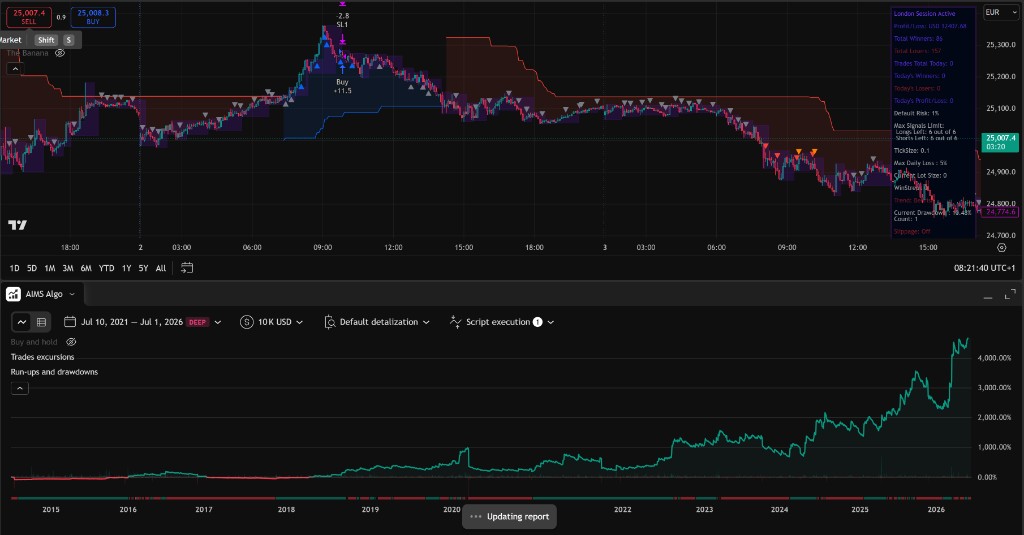
How to read the equity curve
- Slope — whether the simulated equity rose or fell over the selected window.
- Drawdowns — depth and duration of equity dips; compare to your personal risk tolerance.
- Flat periods — may be correct when the strategy had no valid mapped move.
Do not select inputs solely because one backtest window looks smooth.
Before you change inputs to chase metrics
- Confirm data quality for your symbol on TradingView.
- Re-run with default inputs on a second symbol you know well.
- Read the trade list — are losses clustered in one regime?
- Only then adjust settings — see Strategy settings.
Next step
If access or display is wrong, use Troubleshoot TradingView.