ATR Volatility Breakout
iTradeAIMS | NAS100 ATR Breakout (short title AIMS ATRB) is an intraday volatility-expansion breakout strategy. When price pushes beyond a band set a fraction of an average true range (ATR) from the session open, the script looks for directional follow-through.
This is a directional breakout style (Larry Williams family), not mean reversion. Strategy Tester output is a historical simulation — not proof of future performance or a profitability guarantee.
Strategy Tester results are historical simulations. Vendor or frictionless backtests can look better than live trading. Not financial advice.
The entry trigger in the current build fires rarely on some timeframes. Treat early tester reads as smoke tests until the trigger logic is revised for your chart interval. See Known limitation below.
This edge-engine script is publish pending in docs. Use the listed chart name only when it appears in your TradingView access list.
Design timeframe
Intraday — 5-minute to 1-hour. Band width and trigger frequency are timeframe-sensitive; tune the band multiplier per interval you research.
Use a Nasdaq-100 symbol such as NAS100, US100, NDX, or your broker's NQ mapping.
How it works
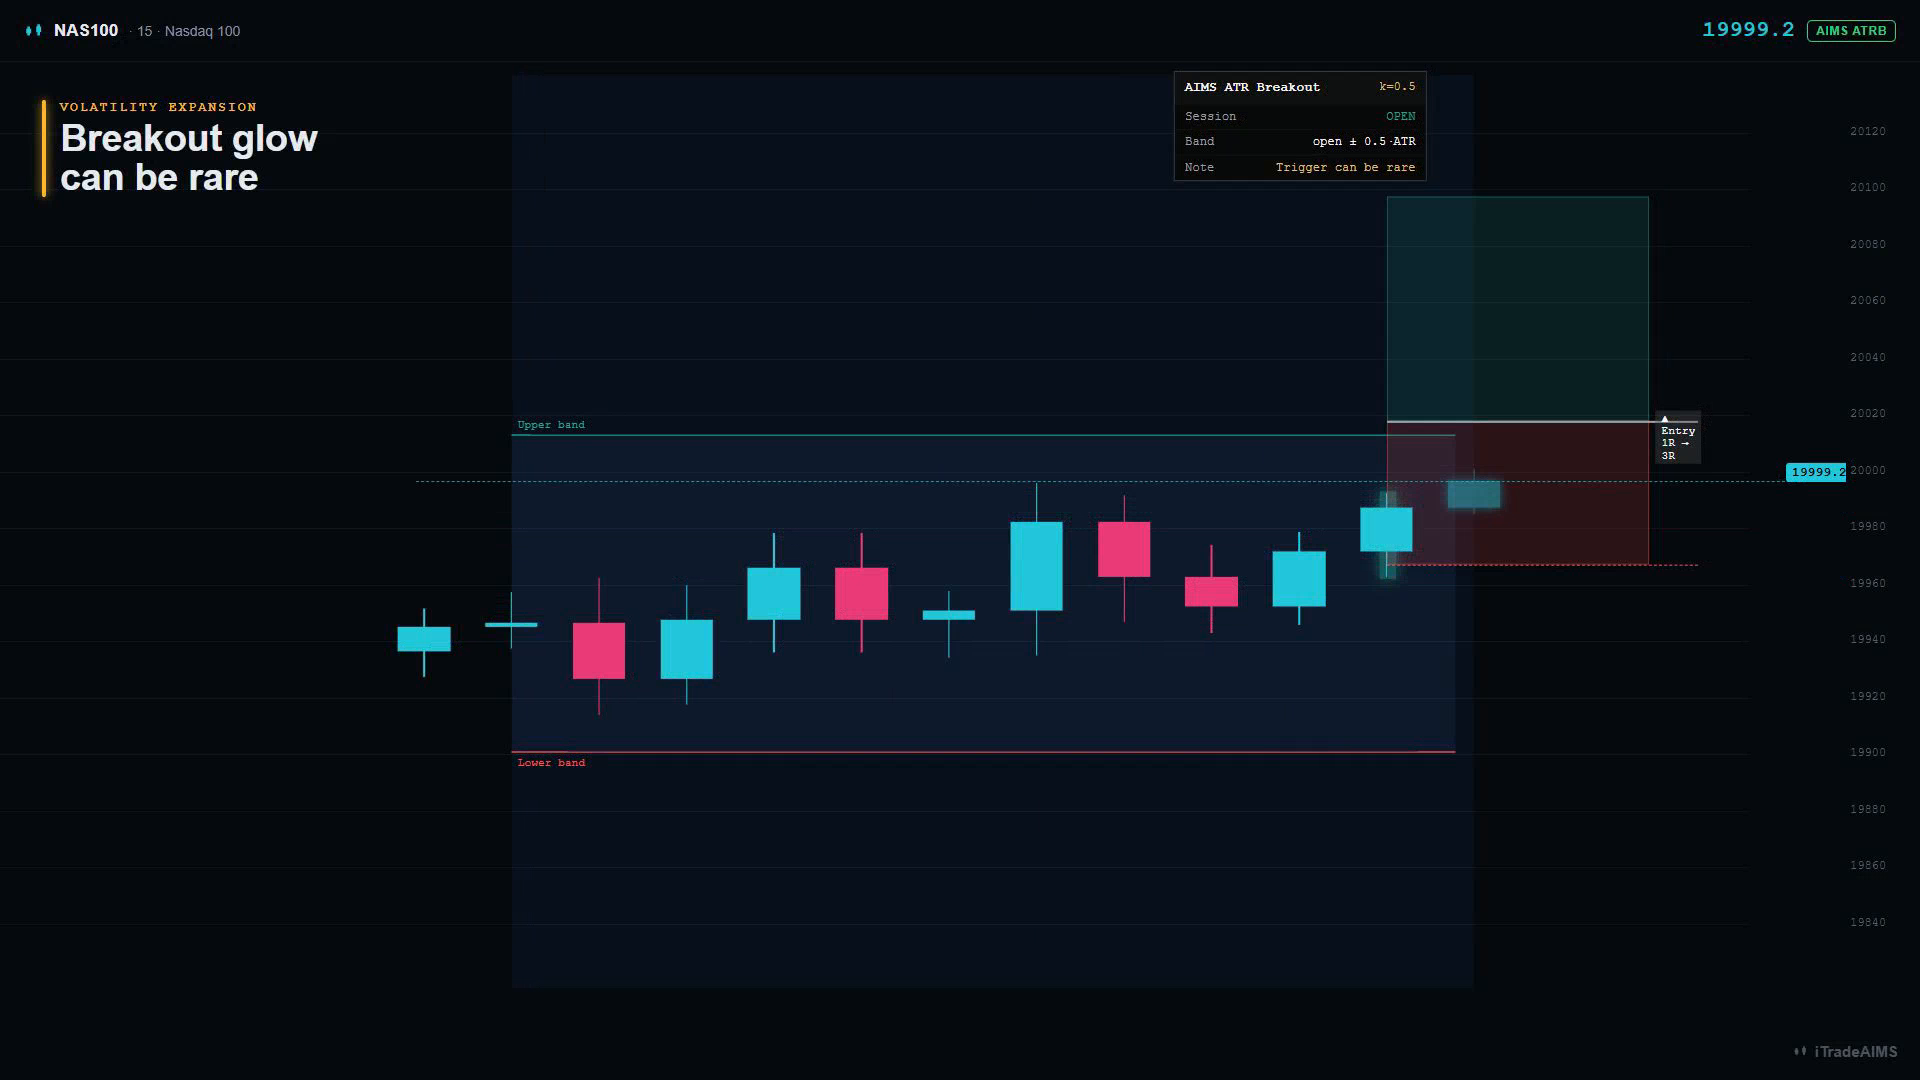
- Bands: each bar draws an upper and lower band from the bar open, using open ± k × ATR (default 0.5 × ATR(10)).
- Long trigger: price crosses above the upper band during the session. Short: price crosses below the lower band.
- Stop: midpoint between entry and the prior bar's extreme.
- Target: default 3R, or flat at session close.
- One trade per day: on by default.
- Sizing: entry-to-stop distance risks a set % of equity (default 1%).
Positions are flat overnight.
What to look for on the chart
| Visual | Meaning |
|---|---|
| Upper band / Lower band | The open ± k·ATR volatility channel |
| Soft channel fill | Normal price envelope |
| Breakout glow | Price outside the channel |
| Red risk box | Entry to stop distance |
| Teal reward box | Entry to target distance |
| Top-right dashboard | k value, trade count, and tester stats |
Key inputs
| Group | Input | Default | Notes |
|---|---|---|---|
| Risk | Risk % per trade | 1.0 | |
| Risk | Target (R multiple) | 3.0 | |
| Breakout | ATR length | 10 | |
| Breakout | Band k (× ATR) | 0.5 | Primary tuning surface (~0.4–0.8) |
| Breakout | One trade per day | on | |
| Breakout | Take longs / shorts | on / on | |
| Session | Restrict to session / window / TZ | on / 09:30–16:00 / New York | |
| Filters | 200-EMA regime filter | off | Long only above / short only below |
| Visuals | Volatility channel (open ± k·ATR) | on | Draws the bands |
| Visuals | Breakout glow (price outside channel) | on | Tints breakout bars |
Chart overlays
- Volatility channel — open ± k·ATR bands with soft fill
- Breakout glow — bars that close beyond the channel tinted (teal up / red down)
- Shared entry / stop / target zones and dashboard
Instrument
NAS100, US100, or NDX on your broker's Nasdaq-100 mapping.
Known limitation
The crossover trigger (high crossing above the upper band) can arm very rarely on some timeframes because the bar high is often already at or above the open. Before relying on tester metrics, confirm the script fires enough trades for your interval, or wait for a revised trigger (stop-entry at the band, close-vs-band gate, or intrabar breach logic).
Tuning notes
- Band k (× ATR) is the main sensitivity lever — walk-forward per timeframe.
- Trending, volatile regimes tend to suit breakout logic better than tight chop; regime context matters.
- Always re-run with honest commission and slippage in Strategy Tester.
First-session checklist
- Confirm the volatility channel is visible.
- Check whether Strategy Tester has a meaningful trade count.
- If trades are extremely rare, treat the result as a trigger test, not a strategy read.
- Leave 200-EMA regime filter off until you understand the base frequency.
- Add costs before comparing any result.
Next steps
- Edge engines overview
- Strategy Tester results
- Start on TradingView — Ultimate NAS100