VWAP Trend Pullback
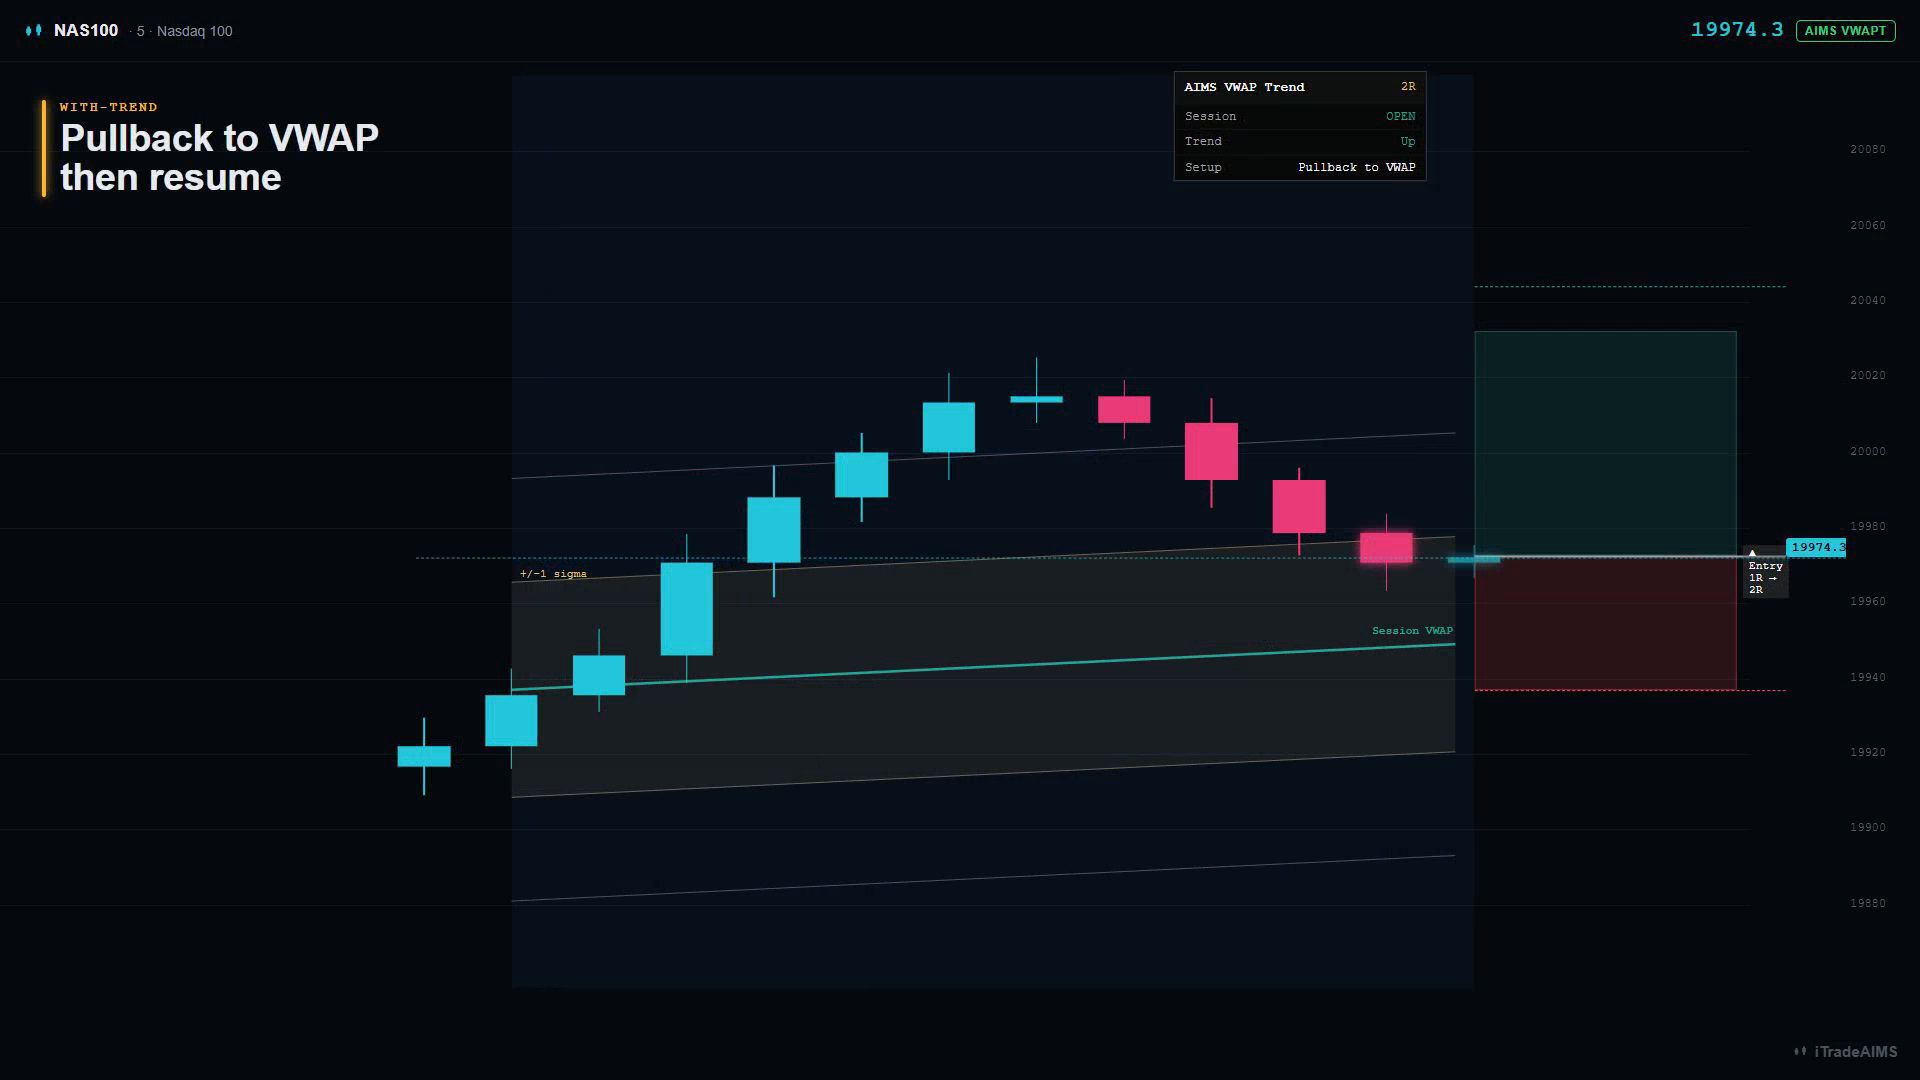
iTradeAIMS | NAS100 VWAP Trend (short title AIMS VWAPT) is an intraday with-trend pullback strategy anchored to session VWAP. In an uptrend, price that dips to VWAP and resumes can continue; the script buys that resumption (mirror logic for downtrends).
This is the cost-robust VWAP variant — trend continuation at VWAP, not a counter-trend fade of extreme deviation bands. Strategy Tester metrics are historical simulations, not guarantees.
Strategy Tester results are historical simulations. Index CFD behaviour can differ from single-stock VWAP studies. Not financial advice.
This edge-engine script is publish pending in docs. Use the listed chart name only when it appears in your TradingView access list.
Design timeframe
Intraday — 5-minute to 1-hour. VWAP is session-anchored; it resets each session and is meant for the chart interval you trade intraday.
Use a Nasdaq-100 symbol such as NAS100, US100, NDX, or your broker's NQ mapping.
How it works
- VWAP: the session's volume-weighted average price, reset each session.
- Trend gate: uptrend means price is above VWAP and the trend EMA is rising. Downtrend is the mirror.
- Long pullback: prior bar touches or pierces VWAP, then the current bar closes back above VWAP on a green candle. Short is the mirror.
- Stop: beyond the pullback swing, padded by a small ATR buffer (default 0.10 × ATR(14)).
- Target: default 2R, or flat at session close.
- Sizing: entry-to-stop risks a set % of equity (default 1%). One trade per day is off by default because pullbacks can recur.
Positions are flat overnight.
What to look for on the chart
| Visual | Meaning |
|---|---|
| Session VWAP | The intraday average price line |
| +1σ / -1σ ribbon | Normal pullback zone around VWAP |
| +2σ / -2σ bands | More extreme deviation area |
| VWAP colour | Teal uptrend, red downtrend, grey neutral |
| Red risk box | Entry to stop distance |
| Teal reward box | Entry to target distance |
Key inputs
| Group | Input | Default | Notes |
|---|---|---|---|
| Risk | Risk % per trade | 1.0 | |
| Risk | Target (R multiple) | 2.0 | |
| Trend / Pullback | Trend EMA length | 50 | With-trend gate |
| Trend / Pullback | Stop buffer (× ATR) | 0.10 | Padding beyond swing extreme |
| Trend / Pullback | One trade per day | off | |
| Trend / Pullback | Take longs / shorts | on / on | |
| Session | Window / TZ | 09:30–16:00 / New York | |
| Visuals | Session VWAP / ±1σ–±2σ ribbon | on / on |
Chart overlays
- VWAP line — coloured by trend (teal up, red down, grey flat)
- ±1σ / ±2σ ribbon — pullback zone inside ±1σ; ±2σ marks extremes
- Shared entry / stop / target zones and dashboard
Instrument
NAS100, US100, or NDX.
Tuning notes
- Main levers: trend EMA length, pullback definition strictness, target (R multiple), and stop buffer.
- Session VWAP is genuinely intraday — run on the timeframe you intend to trade.
- Equity-index VWAP behaviour may not match single-stock backtests; confirm on your Nasdaq-100 symbol and broker feed.
First-session checklist
- VWAP and deviation ribbon are visible during the session.
- Chart timeframe is intraday, not daily.
- You understand whether One trade per day is off or on.
- Strategy Tester has enough pullbacks to review.
- Costs and slippage are added before comparing results.
Next steps
- Edge engines overview
- Strategy Tester results
- Start on TradingView — Ultimate NAS100