NAS100 Edge Engines
Edge engines are separate TradingView strategy scripts in the Nasdaq-100 research lane. Each one turns one market idea into clear rules so you can load it on a Nasdaq-100 chart and study it in Strategy Tester.
They are not beginner "press go" robots. Think of them as four focused research lenses:
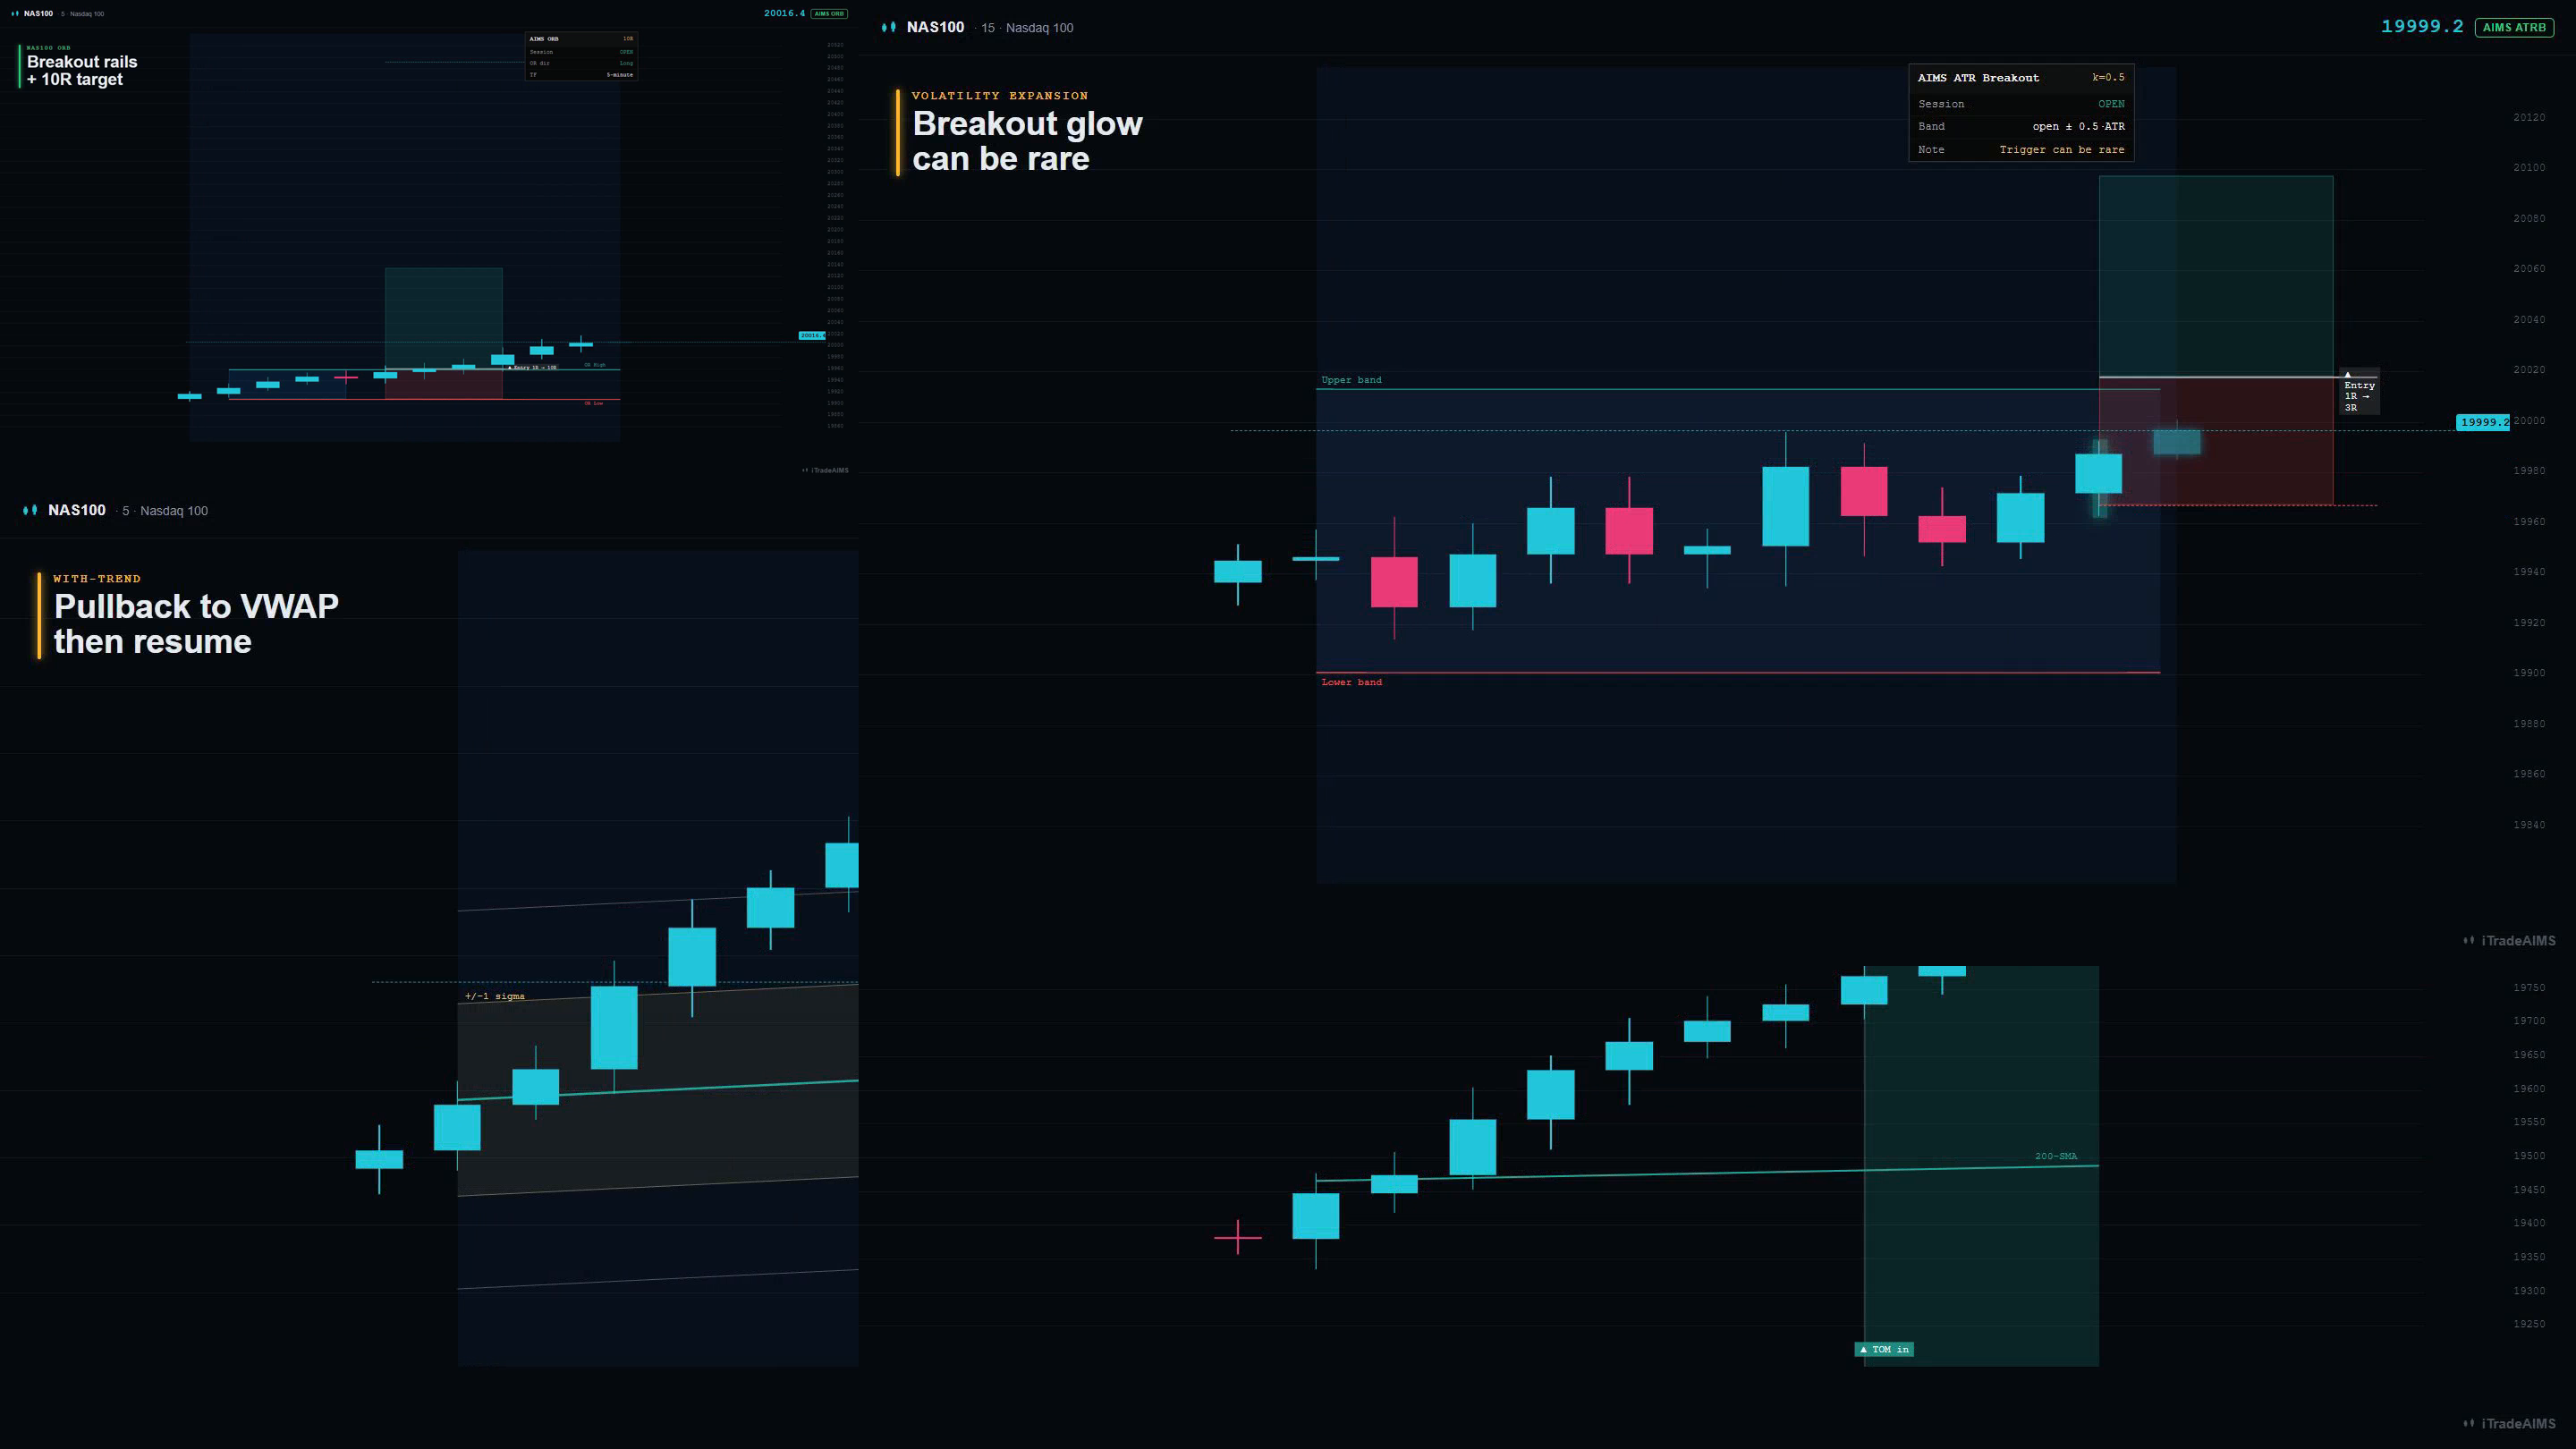
- ORB asks: did the session open create a range that can break and run?
- ATR Breakout asks: is volatility expanding beyond an ATR band?
- VWAP Trend Pullback asks: did price pull back to VWAP and resume with the trend?
- Turn of the Month asks: are we inside the monthly calendar window?
The Ultimate Nasdaq-100 Strategy remains the main customer strategy. Edge engines are optional research builds — use them to study specific ideas, not as a replacement for your primary setup unless you deliberately choose one.
Strategy Tester output is historical simulation on TradingView's data model. Past metrics are not a guarantee of future performance. Slippage, spreads, fills, and broker rules can differ from a backtest. Not financial advice.
The collage below is a teaching diagram of each engine's chart identity (from the Pine visual rules). It is not a live Strategy Tester screenshot. Live captures stay separate until the scripts are published.
Scripts (publish pending)
Opening Range Breakout — 5-minute intraday session breakout. Flat at session close.
ATR volatility expansion breakout — intraday 5-minute to 1-hour. Flat at session close.
Session VWAP with-trend pullback — intraday 5-minute to 1-hour. Flat at session close.
Calendar turn-of-the-month hold — daily chart only. Multi-day / overnight exposure.
TradingView script URLs are not listed here until publication. Confirm access at my.itradeaims.net -> License Center when scripts go live. Do not use guessed TradingView links.
The four engines
| Engine | Chart name | Best first chart | Hold style | Start with |
|---|---|---|---|---|
| Opening Range Breakout | iTradeAIMS | NAS100 ORB | 5-minute | Intraday, flat at session close | US cash session open |
| ATR Volatility Breakout | iTradeAIMS | NAS100 ATR Breakout | 5-minute to 1-hour | Intraday, flat at session close | Confirm enough trades fire |
| VWAP Trend Pullback | iTradeAIMS | NAS100 VWAP Trend | 5-minute to 1-hour | Intraday, flat at session close | Session VWAP visible |
| Turn of the Month | iTradeAIMS | NAS100 Turn-of-Month | Daily | Calendar window, multi-day hold | Daily NAS100 / US100 / NDX |
Which one should I open first?
| If you want to study... | Open this engine |
|---|---|
| The first move after the US open | Opening Range Breakout |
| Momentum after volatility expands | ATR Volatility Breakout |
| Pullbacks back to the session average | VWAP Trend Pullback |
| A monthly calendar effect | Turn of the Month |
How to use these pages
- Pick an engine that matches the timeframe you intend to research.
- Add it to a Nasdaq-100 symbol (US100, NAS100, NDX, QQQ, or your broker's NQ mapping).
- Start on the design timeframe before changing inputs.
- Open Strategy Tester and confirm the chart overlays match the engine's page.
- Add honest commission and slippage before treating any result as useful.
- Compare against The Ultimate Nasdaq-100 Strategy if you need the primary customer product path.
Beginner guardrails
- Keep each engine separate. Do not stack all four and try to trade every marker.
- Do not compare ORB on a 5-minute chart with Turn-of-Month on an hourly chart; their design timeframes are different.
- A high Profit Factor on a tiny sample is not enough. Check trade count, costs, drawdown, and whether the timeframe is correct.
- These pages explain what the scripts do. They do not claim that any engine is profitable live.
Next steps
- Start on TradingView — Ultimate NAS100 fast path
- Strategy Tester results — how to read backtest metrics
- Strategy settings — primary strategy inputs