Opening Range Breakout (ORB)
iTradeAIMS | NAS100 ORB (short title AIMS ORB) is an intraday opening-range breakout strategy for Nasdaq-100 charts. It captures the first minutes of the regular session as a range, then trades a breakout in the direction set by that range.
The idea is asymmetry: accept that many opening breakouts may fail, but aim for a larger reward when one runs. This is why the default target is high (10R) and why the page keeps warning you not to judge it by win rate alone.
Strategy Tester results are historical simulations. Commission, slippage, and live fills can change outcomes materially. Not financial advice.
This edge-engine script is publish pending in docs. Use the listed chart name only when it appears in your TradingView access list.
Design timeframe
Run on a 5-minute Nasdaq-100 chart for the intended read. The opening-range length is measured in minutes from the session open. Other intraday timeframes can be tested, but 5-minute is the design point.
Use a symbol that matches Nasdaq-100 context: NAS100, US100, NDX, QQQ, or your broker's NQ mapping.
How it works
- Opening range: during the first few minutes after the regular session open (default 5 minutes), the script records the high and low.
- Direction: if the opening-range candle closes above its open, the day is treated as long-biased; below its open, short-biased; doji skips the day.
- Entry: the strategy enters at the next bar's open in the chosen direction.
- Stop: opposite side of the opening range. Entry to stop = 1R.
- Target: default 10R, or flat at session close if the target is not hit.
- One trade per day: after the opening-range decision, it does not keep re-entering.
Positions are flat overnight — no hold past the configured regular session.
What to look for on the chart
| Visual | Meaning |
|---|---|
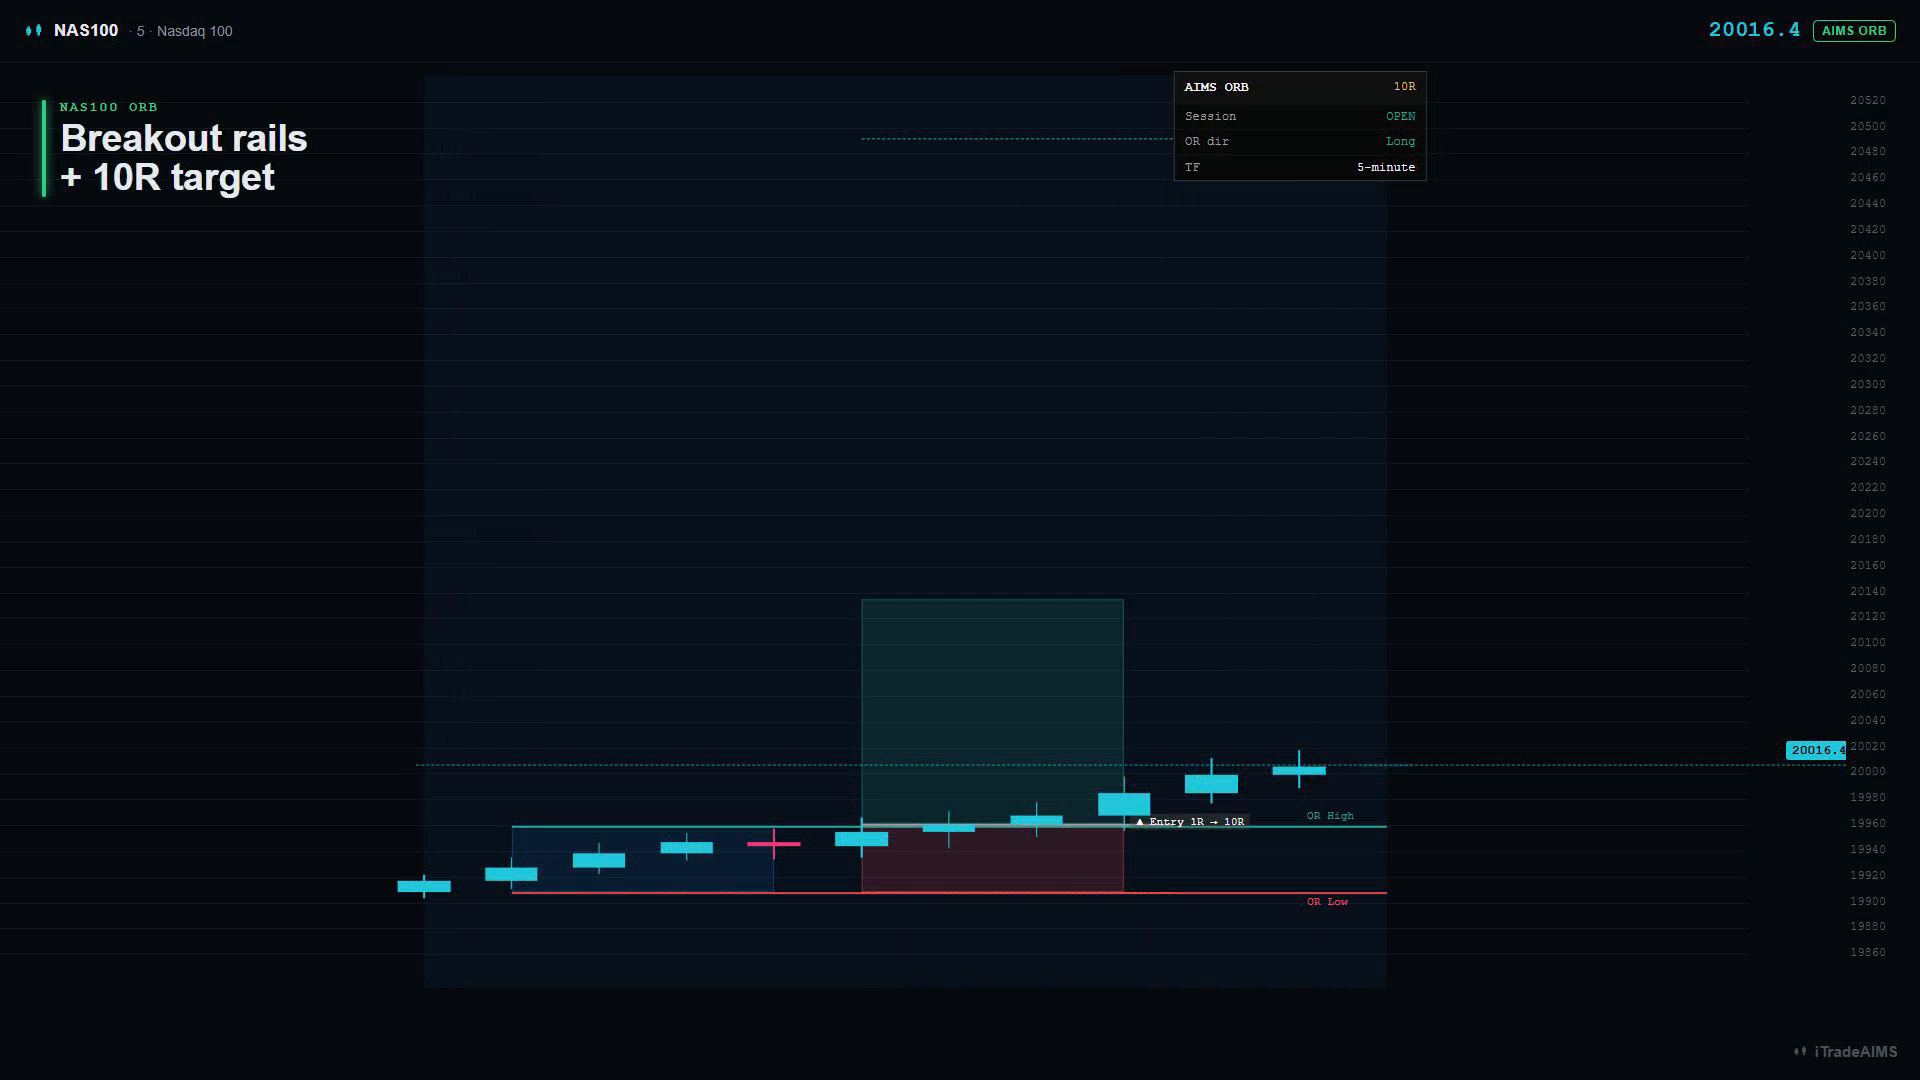
| Opening-range box | The first session range being measured |
| OR High rail | Breakout level for long-side context |
| OR Low rail | Breakout level for short-side context |
| Red risk box | Entry to stop distance |
| Teal reward box | Entry to target distance |
| Top-right dashboard | Summary stats and target R |
Key inputs
| Group | Input | Default | Notes |
|---|---|---|---|
| Risk | Risk % per trade | 1.0 | Equity risked to the opening-range stop |
| Risk | Target (R multiple) | 10.0 | Reward relative to stop distance |
| Opening Range | Opening-range length (min) | 5 | Minutes from session open |
| Opening Range | Regular session | 09:30–16:00 | US cash session; adjust per feed |
| Opening Range | Session timezone | America/New_York | |
| Opening Range | Take longs / shorts | on / on | |
| Filters | 200-EMA regime filter | off | Long only above / short only below |
| Visuals | Opening-range box | on | Draws the first range |
| Visuals | Breakout rails (OR high/low) | on | Extends the high/low across the session |
| Visuals | Session tint | on | Shows the active session window |
Chart overlays
- Opening-range box — high/low band during the range window
- Breakout rails — range high and low extended through the session; the taken side highlights
- Session tint — active trade window
- Shared entry / stop / target zones and top-right dashboard
Instrument and session
Use NAS100, US100, NDX, or QQQ with the session window set to your feed's most liquid cash session.
Tuning notes
- Target (R multiple) and opening-range length are the main levers — walk-forward test changes; avoid curve-fitting to one window.
- The optional 200-EMA regime filter can reduce counter-trend breakouts.
- Costs matter: many exits are stops or the end-of-day market close. Re-run Strategy Tester with realistic commission and slippage before drawing conclusions.
First-session checklist
- Chart timeframe is 5 minutes.
- Session is set to the feed's correct US cash window.
- Opening-range box and rails are visible.
- Strategy Tester shows enough trades to review, not just one or two examples.
- You review costs and slippage before comparing results.
Next steps
- Edge engines overview
- Strategy Tester results
- Start on TradingView — Ultimate NAS100