Box Levels
Box levels are the main visual feature of The Setup Indicator MT5.
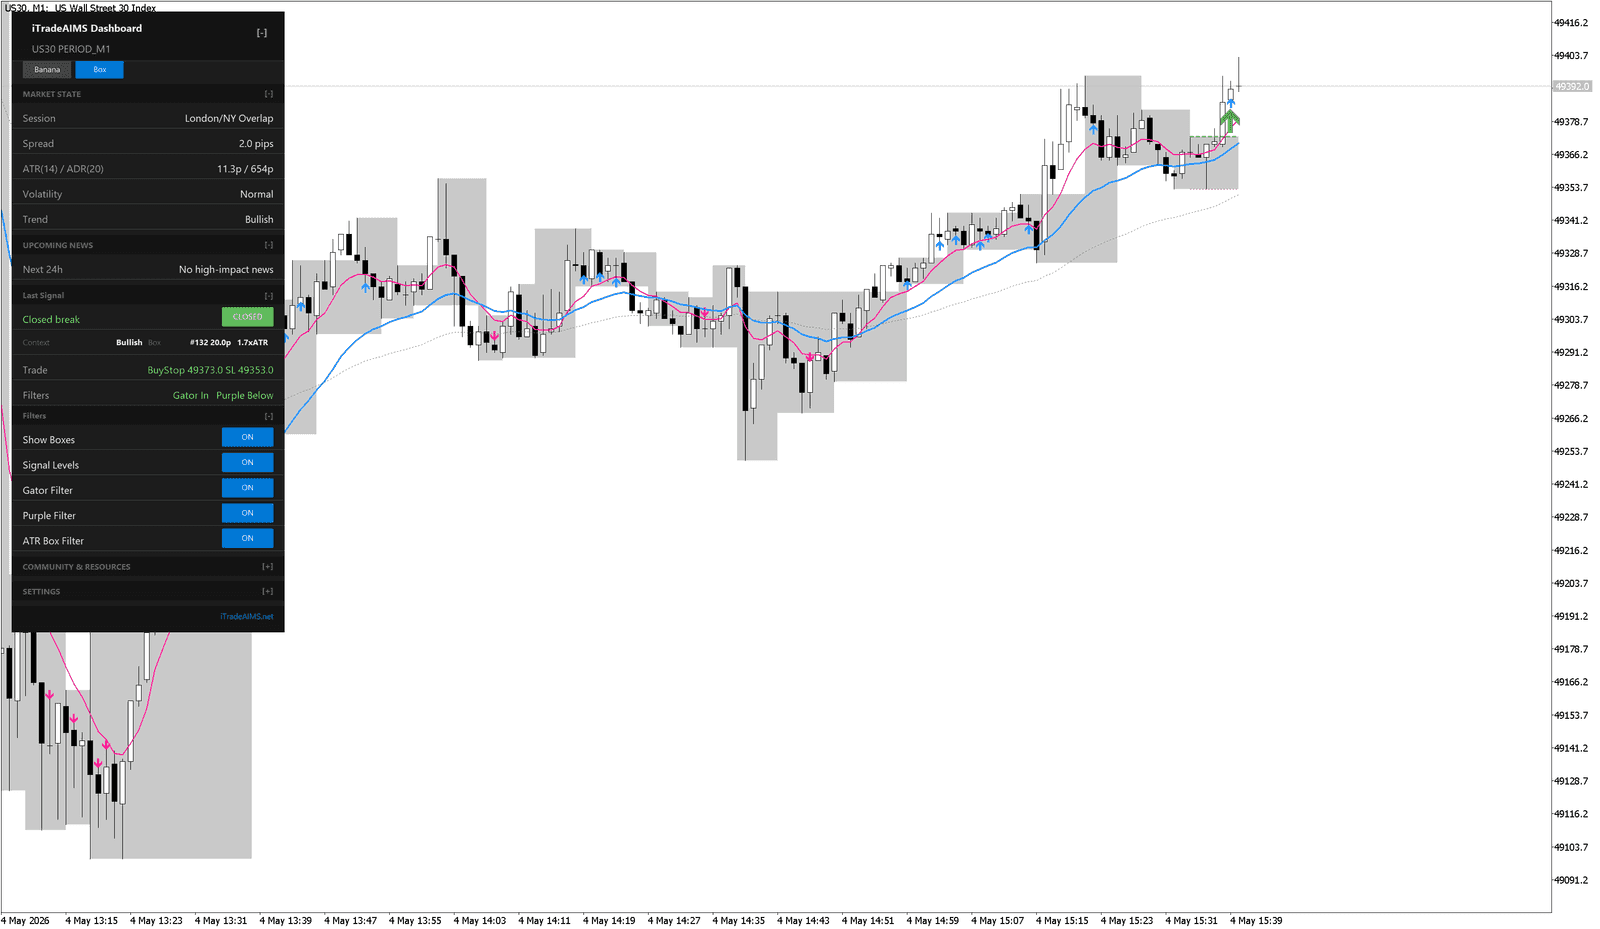
Grey Box Zones
The grey zone shows the area between the current upper and lower AIMS Box levels.
When price is inside the zone, price is still inside the box. When price breaks and closes beyond a level, the dashboard may show a break or setup state.
Upper And Lower Levels
The top of the box is the upper level. The bottom of the box is the lower level.
These levels can be used as:
- Breakout references.
- Stop-placement references.
- Structure for reviewing whether price is trapped or moving.
- Trailing references after a position is already open.
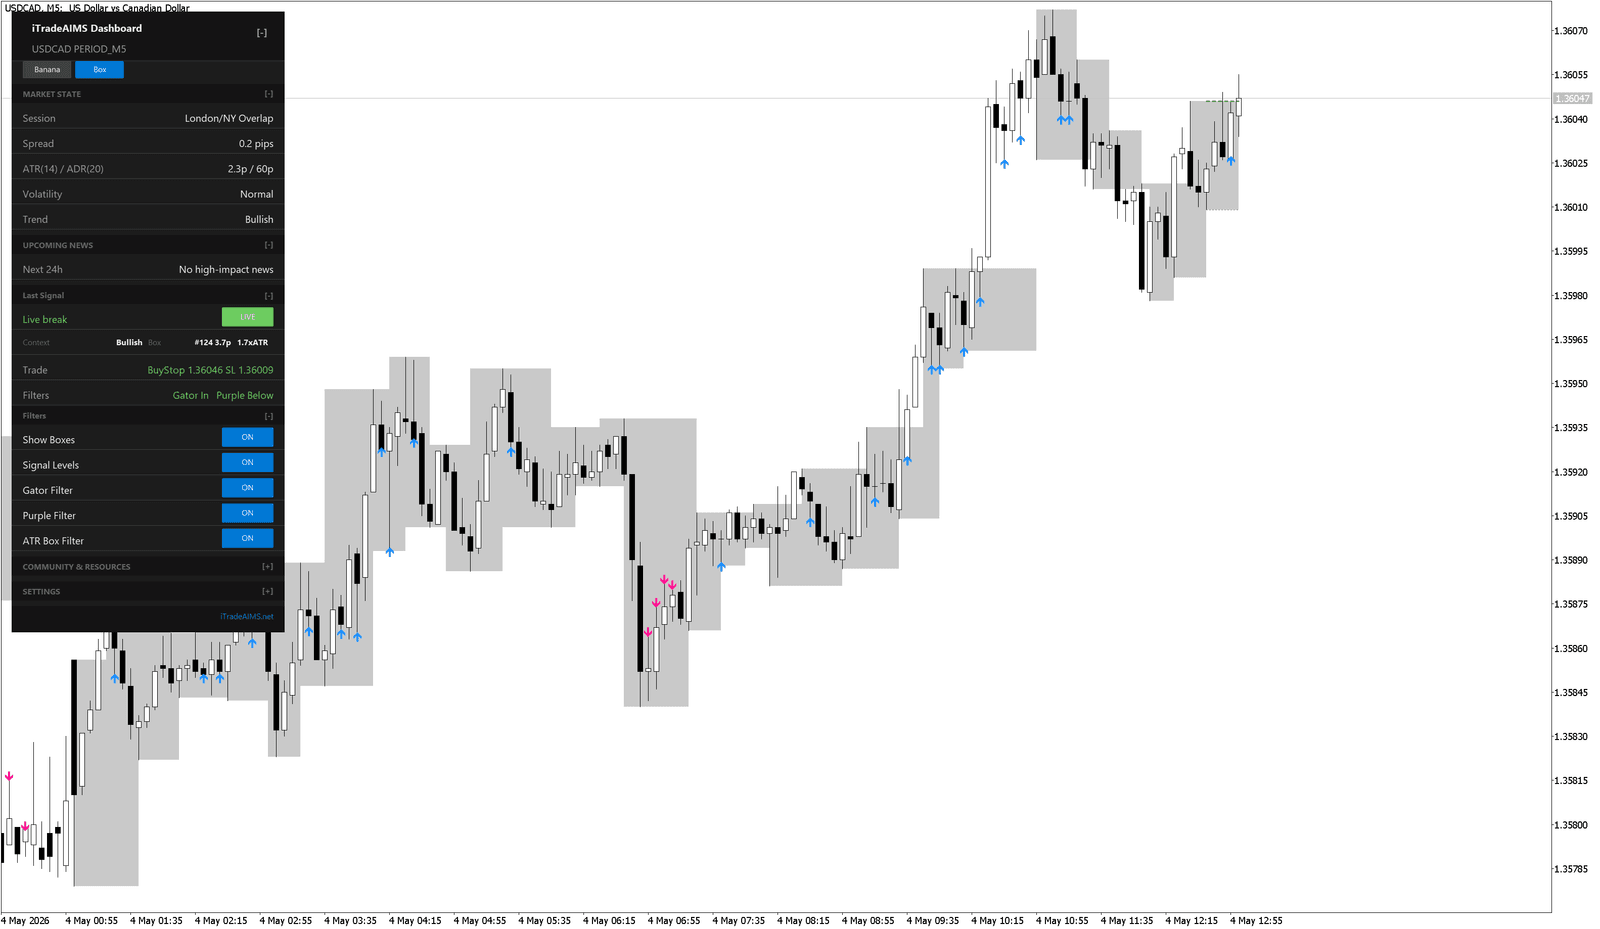
Signal Levels
If Show Active Box Signal Levels or Signal Levels is enabled, the indicator can display reference lines for the current candidate setup.
These are information lines. Before acting on them, review the setup, spread, filters, and risk.
Closed Breaks
A closed break means price has closed beyond the relevant box level.
When possible, wait for the relevant candle to close before treating a break as confirmed.
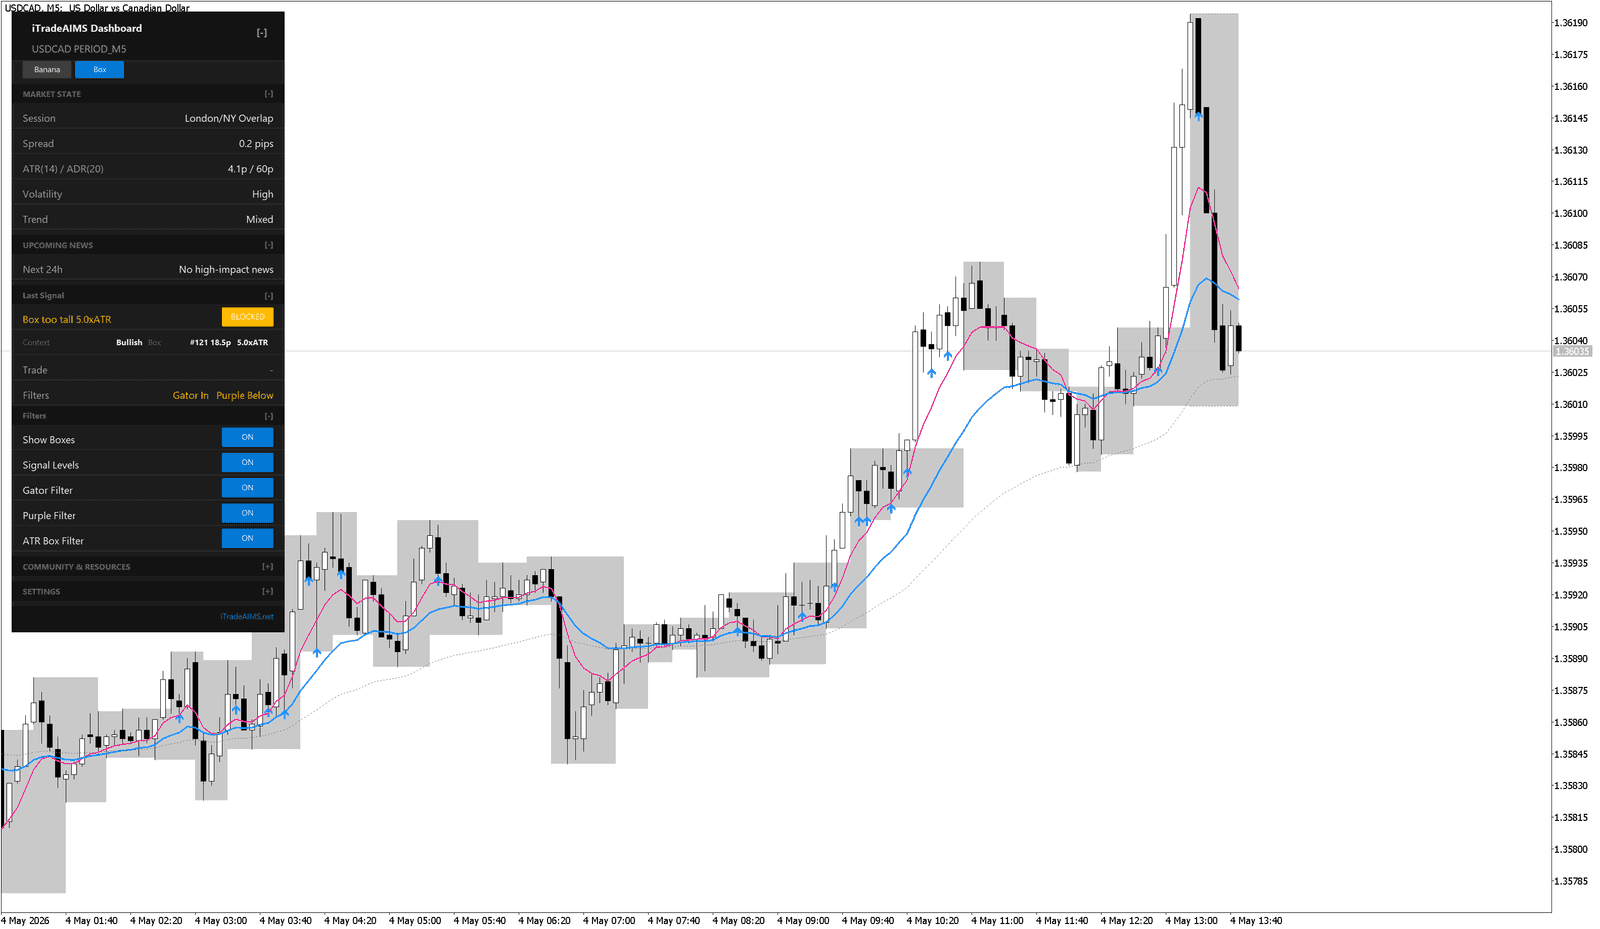
Blocked Boxes
The indicator can block a setup when context does not meet the current rules or filters.
Common reasons include:
- The box is too tall.
- Gator context does not agree.
- Purple context does not agree.
- The ATR Box filter rejects the setup.
- AIMS Confluence Indicator dashboard market-state checks are not acceptable, where those checks are available.
Best Practice
Keep boxes visible while learning. Once you understand the structure, you can adjust visibility and theme settings to make the chart cleaner.