Validate a Banana Signal
The Banana Indicator can help you notice a possible signal, but the marker is only the start of the review.
Use this page when a signal appears and you want a structured way to decide whether the chart still deserves attention.
Members can access the complete Banana signal rules tutorial in the iTradeAIMS membership portal. Strategy background: Banana strategy rules · The 7 rules.
Basic Review Checklist
Before acting on a signal, check:
- Is the market moving clearly, or is it stuck in a range?
- Is the signal in the same direction as the move you want to trade?
- Is price close to support, resistance, a session high, or a session low?
- Is the spread acceptable for your symbol?
- Is there major news or a market open that could change conditions?
- Has the signal candle closed?
- Do you know where your stop loss would go?
- Is the possible reward worth the risk?
If you cannot answer these questions, skip the signal and wait for a cleaner chart.
Structure flowchart
Two views of the same review — pick whichever reads easier for you.
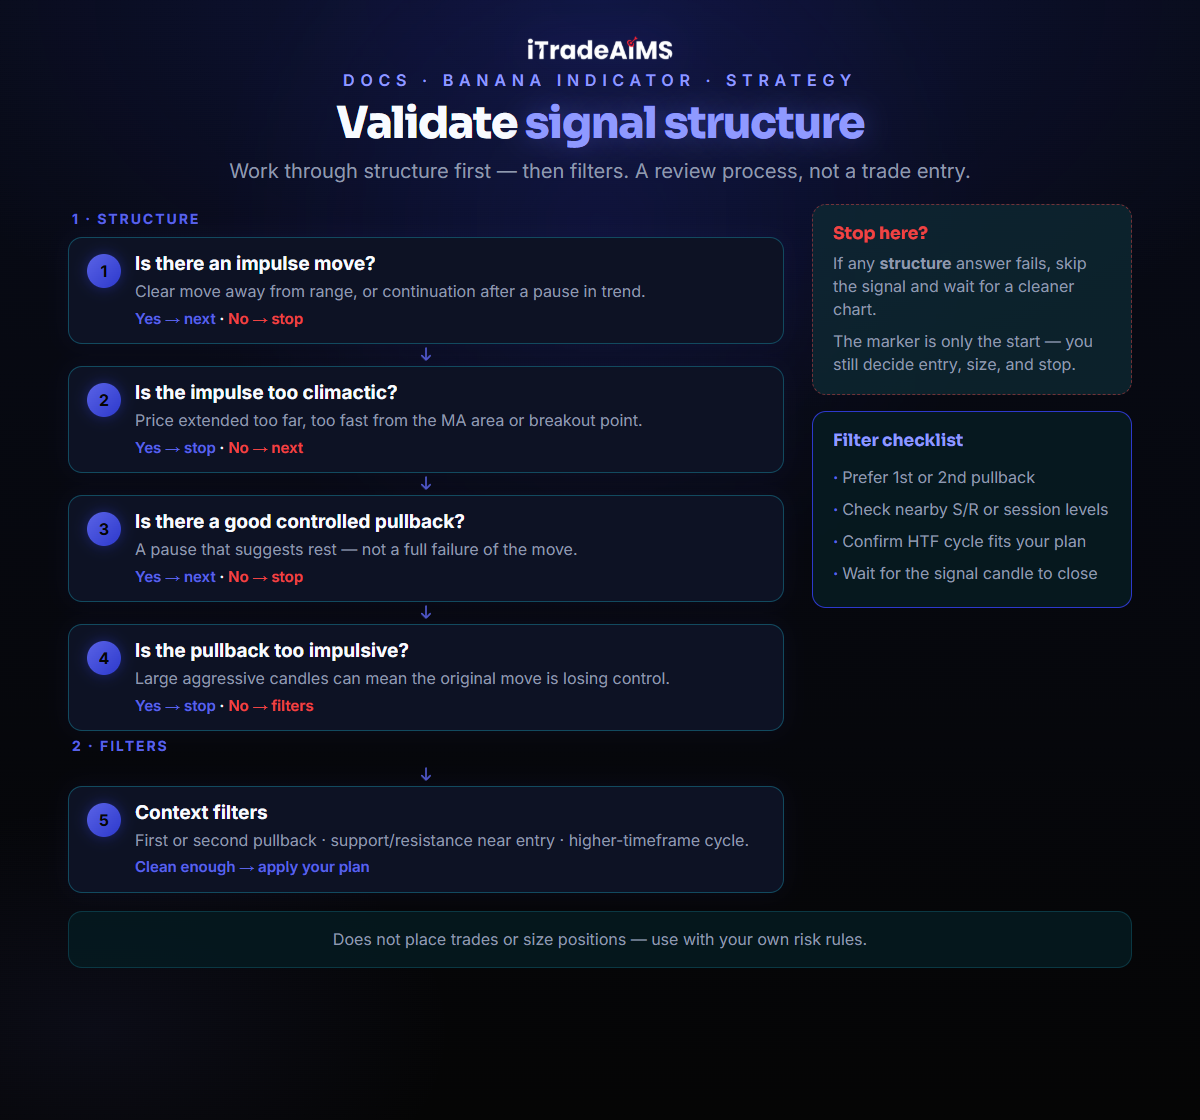
Step-by-step panel
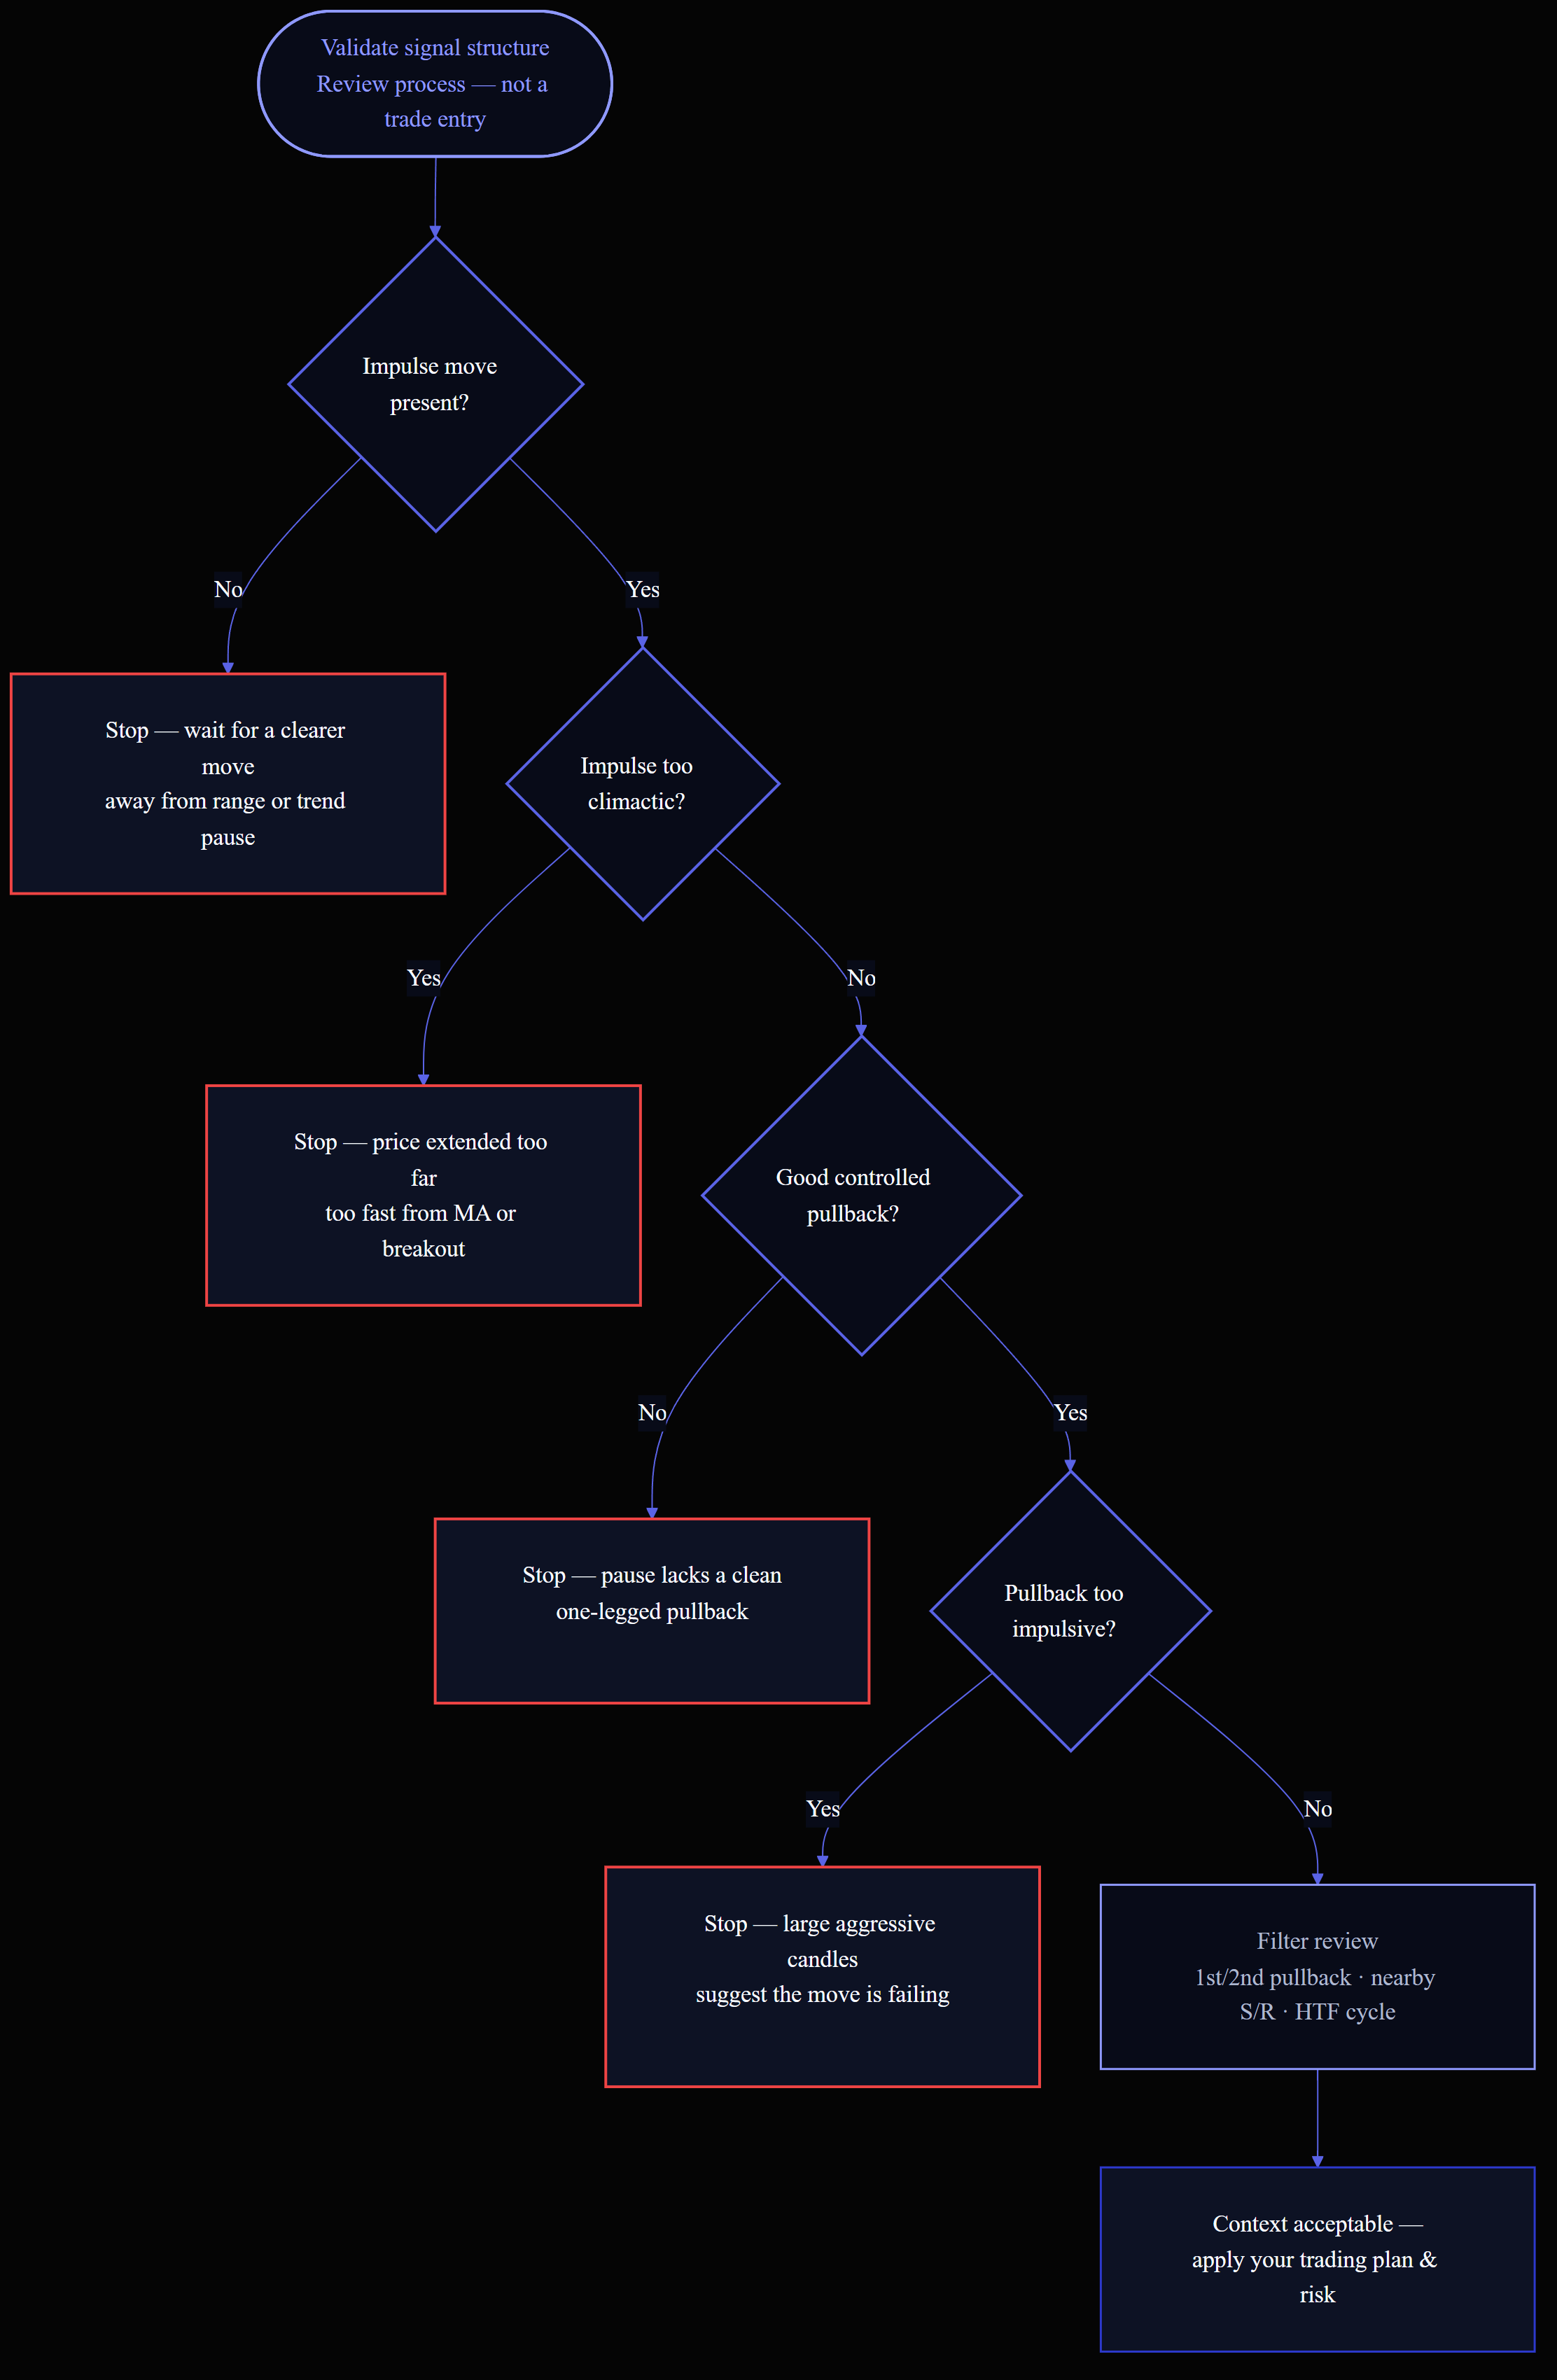
Decision tree
What The Flowchart Helps You Check
The flowchart is a review process. It does not decide whether a trade should be taken.
Work through the rules in order:
- Where is the impulse move? Look for a clear move away from a trading range, or a fresh continuation move after a pause inside an existing trend.
- Is there a good pullback? The pullback should be controlled enough to suggest a pause, not a full failure of the move.
- Is the impulse move too climactic? Be careful when price has moved too far too quickly from the moving-average area or breakout point.
- Is the pullback too impulsive? A pullback made of large aggressive candles can mean the original move is losing control.
- Is this the first or second pullback? Day traders often prefer earlier pullbacks because late entries can appear after the easiest part of the move has passed.
- Is support or resistance close to the entry area? Nearby levels can reduce the quality of the opportunity or change where risk needs to be placed.
- What is the higher-timeframe market cycle? Higher-timeframe context can help you decide whether the current signal fits the broader market condition.
Start with the first four rules. They decide whether the signal structure is still reasonable. Use the final three rules as filters — rules 5–6 are required; rule 7 is optional. They help you decide whether the chart context is clean enough for your own trading plan.
Completed Candles
Do not rush a forming candle. A signal is most useful when reviewed after the candle has confirmed.
On fast timeframes, this means waiting for the current candle to finish before making a decision. If your platform or alert setting can notify before candle close, treat that as an early warning only.
What The Indicator Can Help With
The indicator can help you:
- Notice potential Banana and Seed patterns.
- Keep signal markers consistent.
- Use alerts so you do not need to stare at the chart.
- Review signals on different symbols or timeframes.
- See dashboard feedback where available.
What You Must Still Decide
You decide:
- Whether the market condition is suitable.
- Whether the signal fits your plan.
- Whether to enter, wait, or skip.
- Position size.
- Stop loss and trade management.
On TradingView, zones and exit marks are reference levels — partial exits and break-even stops are your plan. See B2 Banana buy signal and S2 — stop hit.
Practice Workflow
For your first sessions:
- Use a demo account or chart-only review.
- Observe signals without entering trades.
- Write down why you would take or skip each signal.
- Compare your decisions after the market moves.
- Change settings only after you understand what is happening.
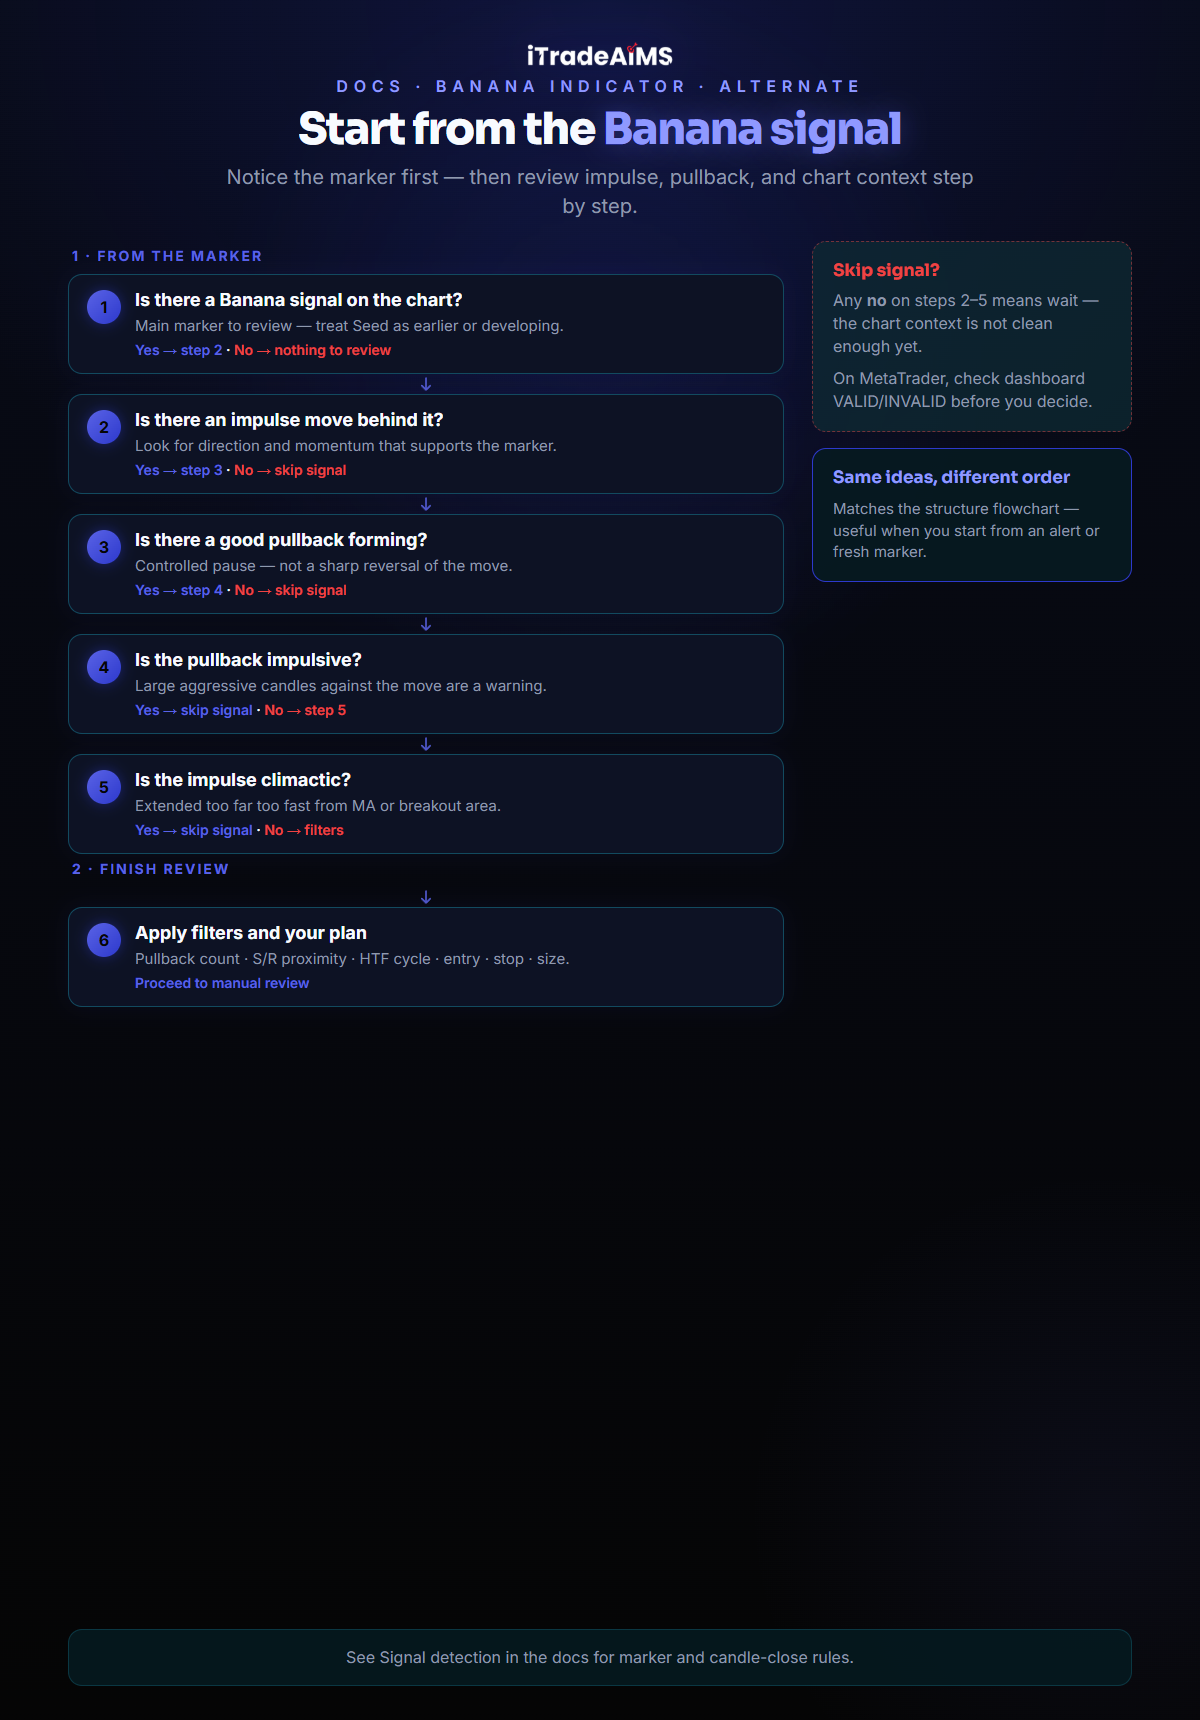
Alternate flowchart
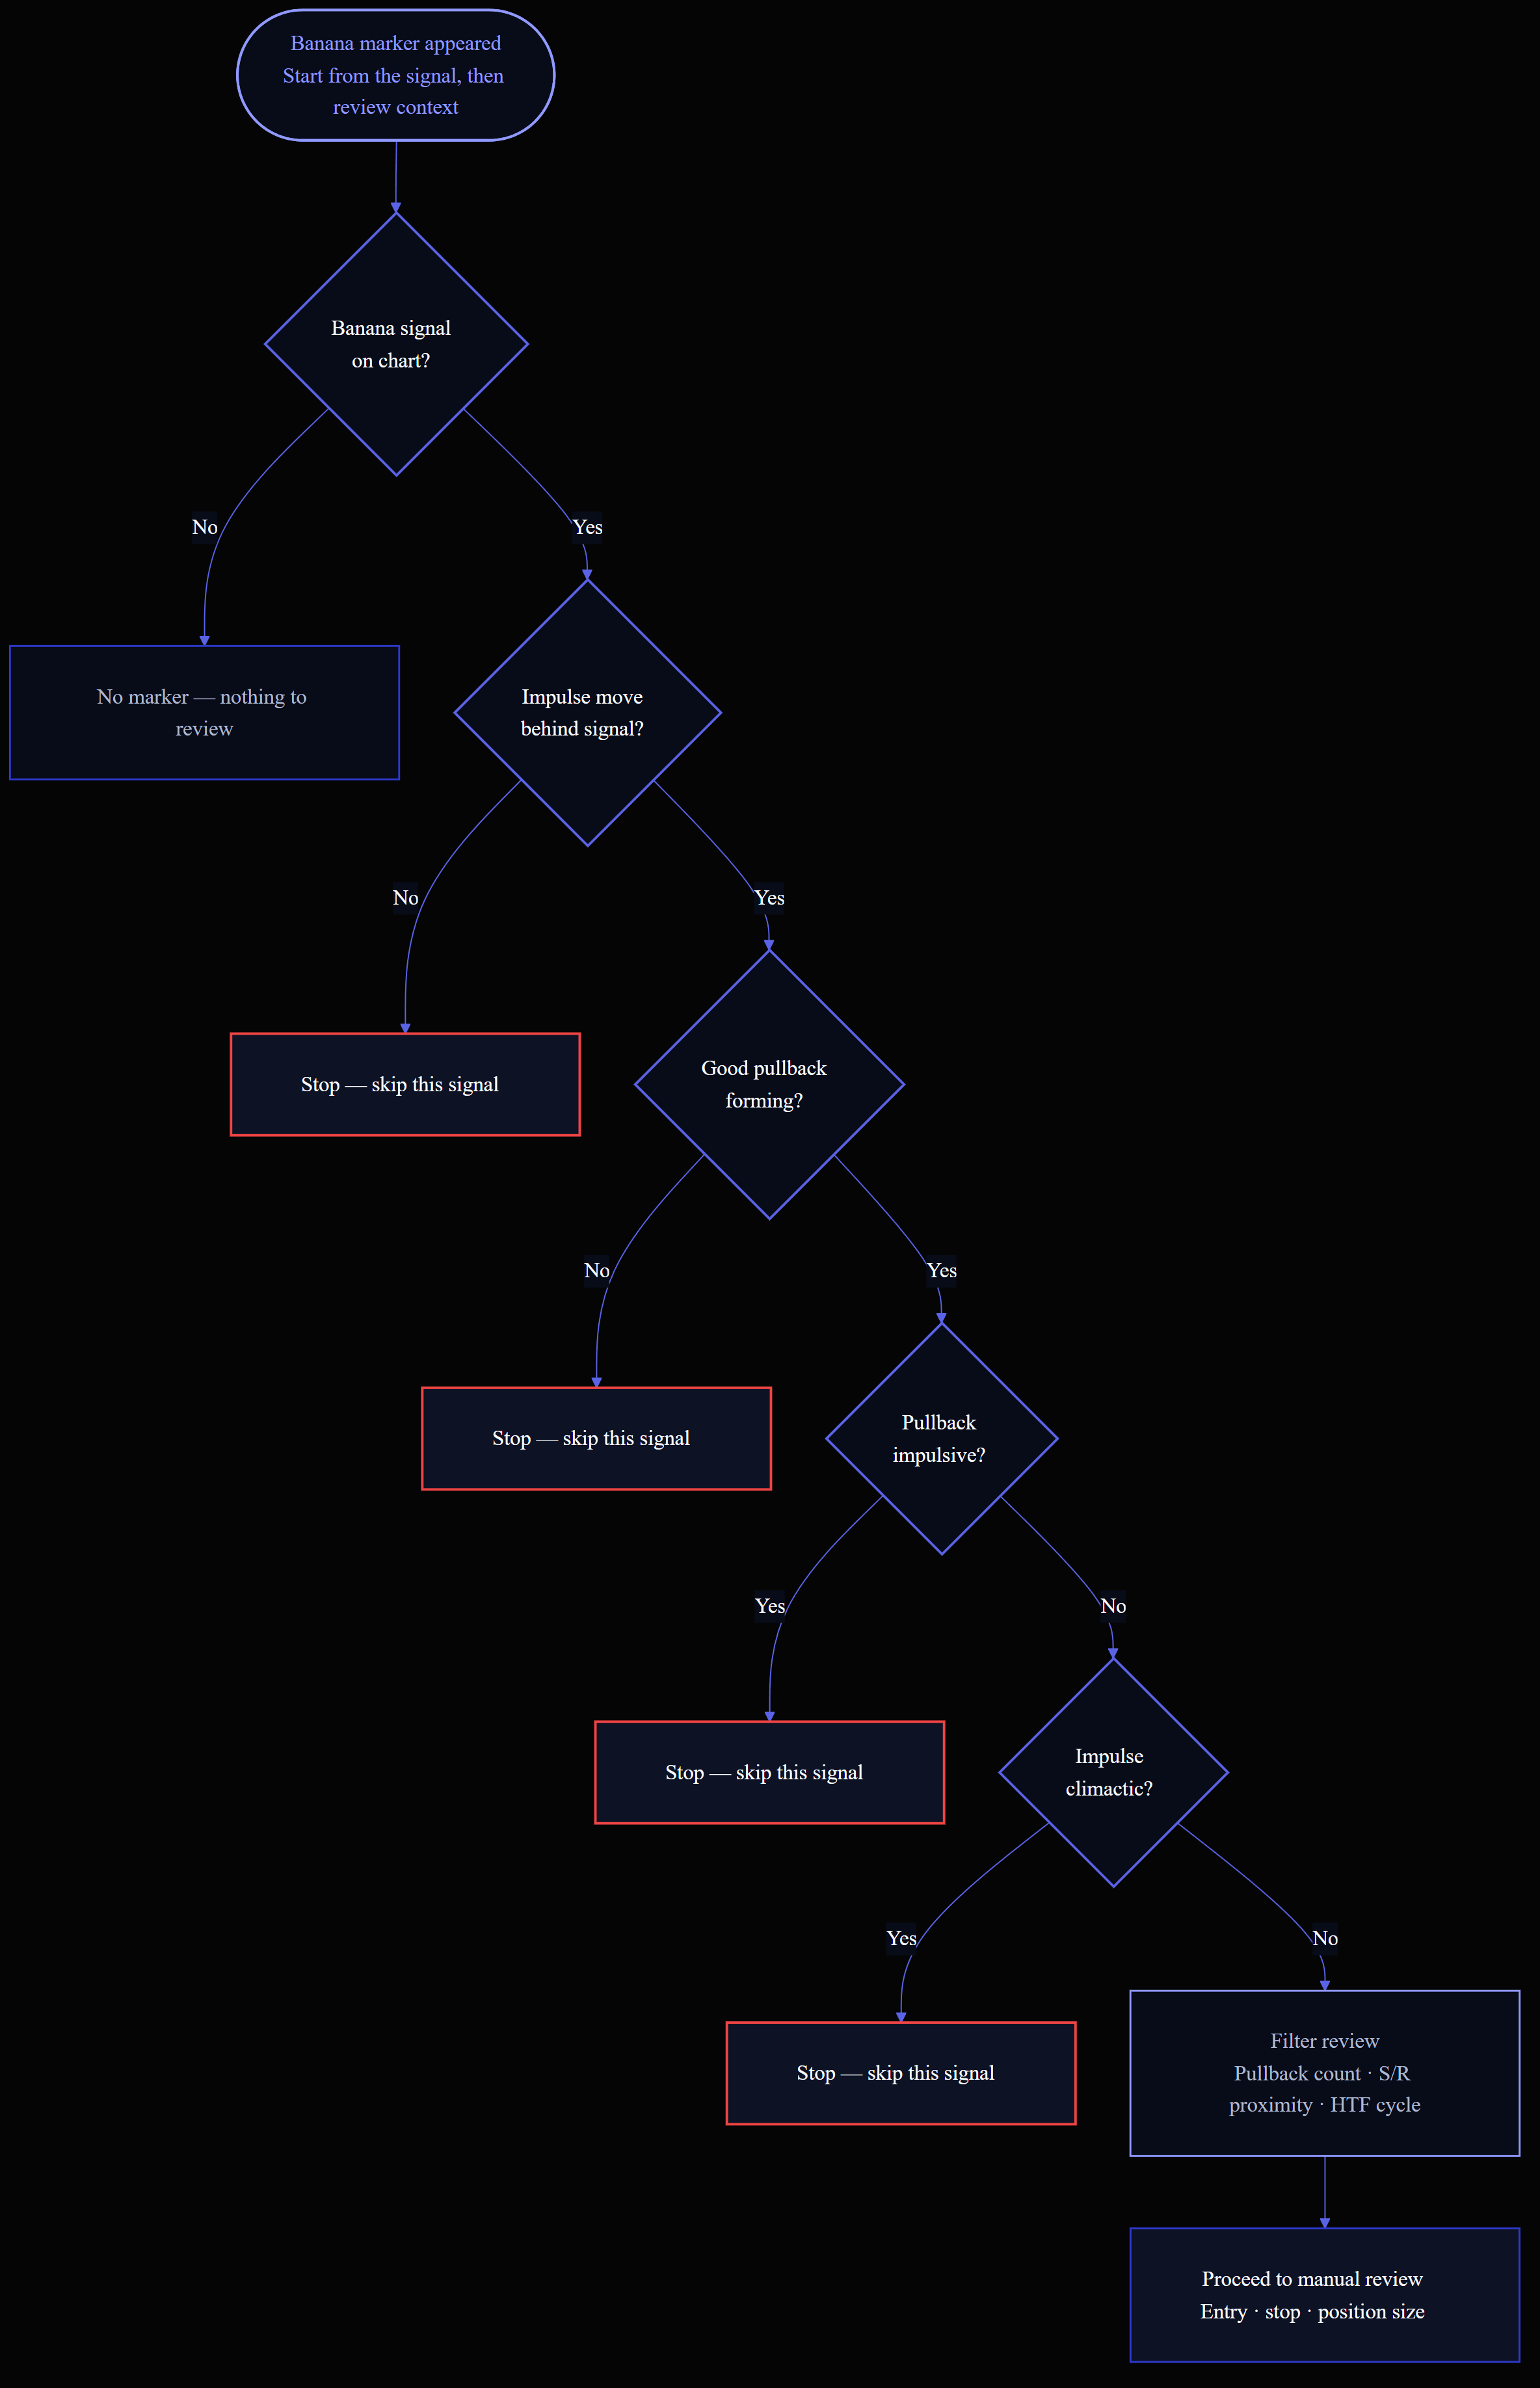
Some users prefer to start by noticing the signal and then processing the chart information step by step. These alternate views present the same ideas in signal-first order (marker → impulse → pullback → filters).
Step-by-step panel
Decision tree
Risk Reminder
The Banana Indicator provides chart information. It does not remove trading risk, choose position size, or manage the trade for you.
You remain responsible for deciding whether the market condition, stop placement, position size, and account risk fit your own trading plan.
Next Steps
- Banana strategy rules — 7-rule methodology
- The 7 rules — impulse, pullback, filters
- Signal detection
- How to use The Banana Indicator
- Choose your platform
- Chart examples (TradingView)