Signals
Real v3 charts from owner review sessions (XAUUSD unless noted). Use these after Start Here to see how B# / S# labels, zones, Smart Trail, exit marks, and the dashboard look in live conditions.
Screenshots show setups to review. They are not trade recommendations. Partial exits, break-even stops, and position management are your trading plan — the indicator draws levels; it does not manage positions.
Buy signal examples
| # | Scenario | Signal | Outcome |
|---|---|---|---|
| B1 | Banana buy signal | B# at consolidation break | LONG zones + bullish Smart Trail |
| B2 | Banana buy signal | B# LONG live | TP1 tagged; price reverses before TP2 |
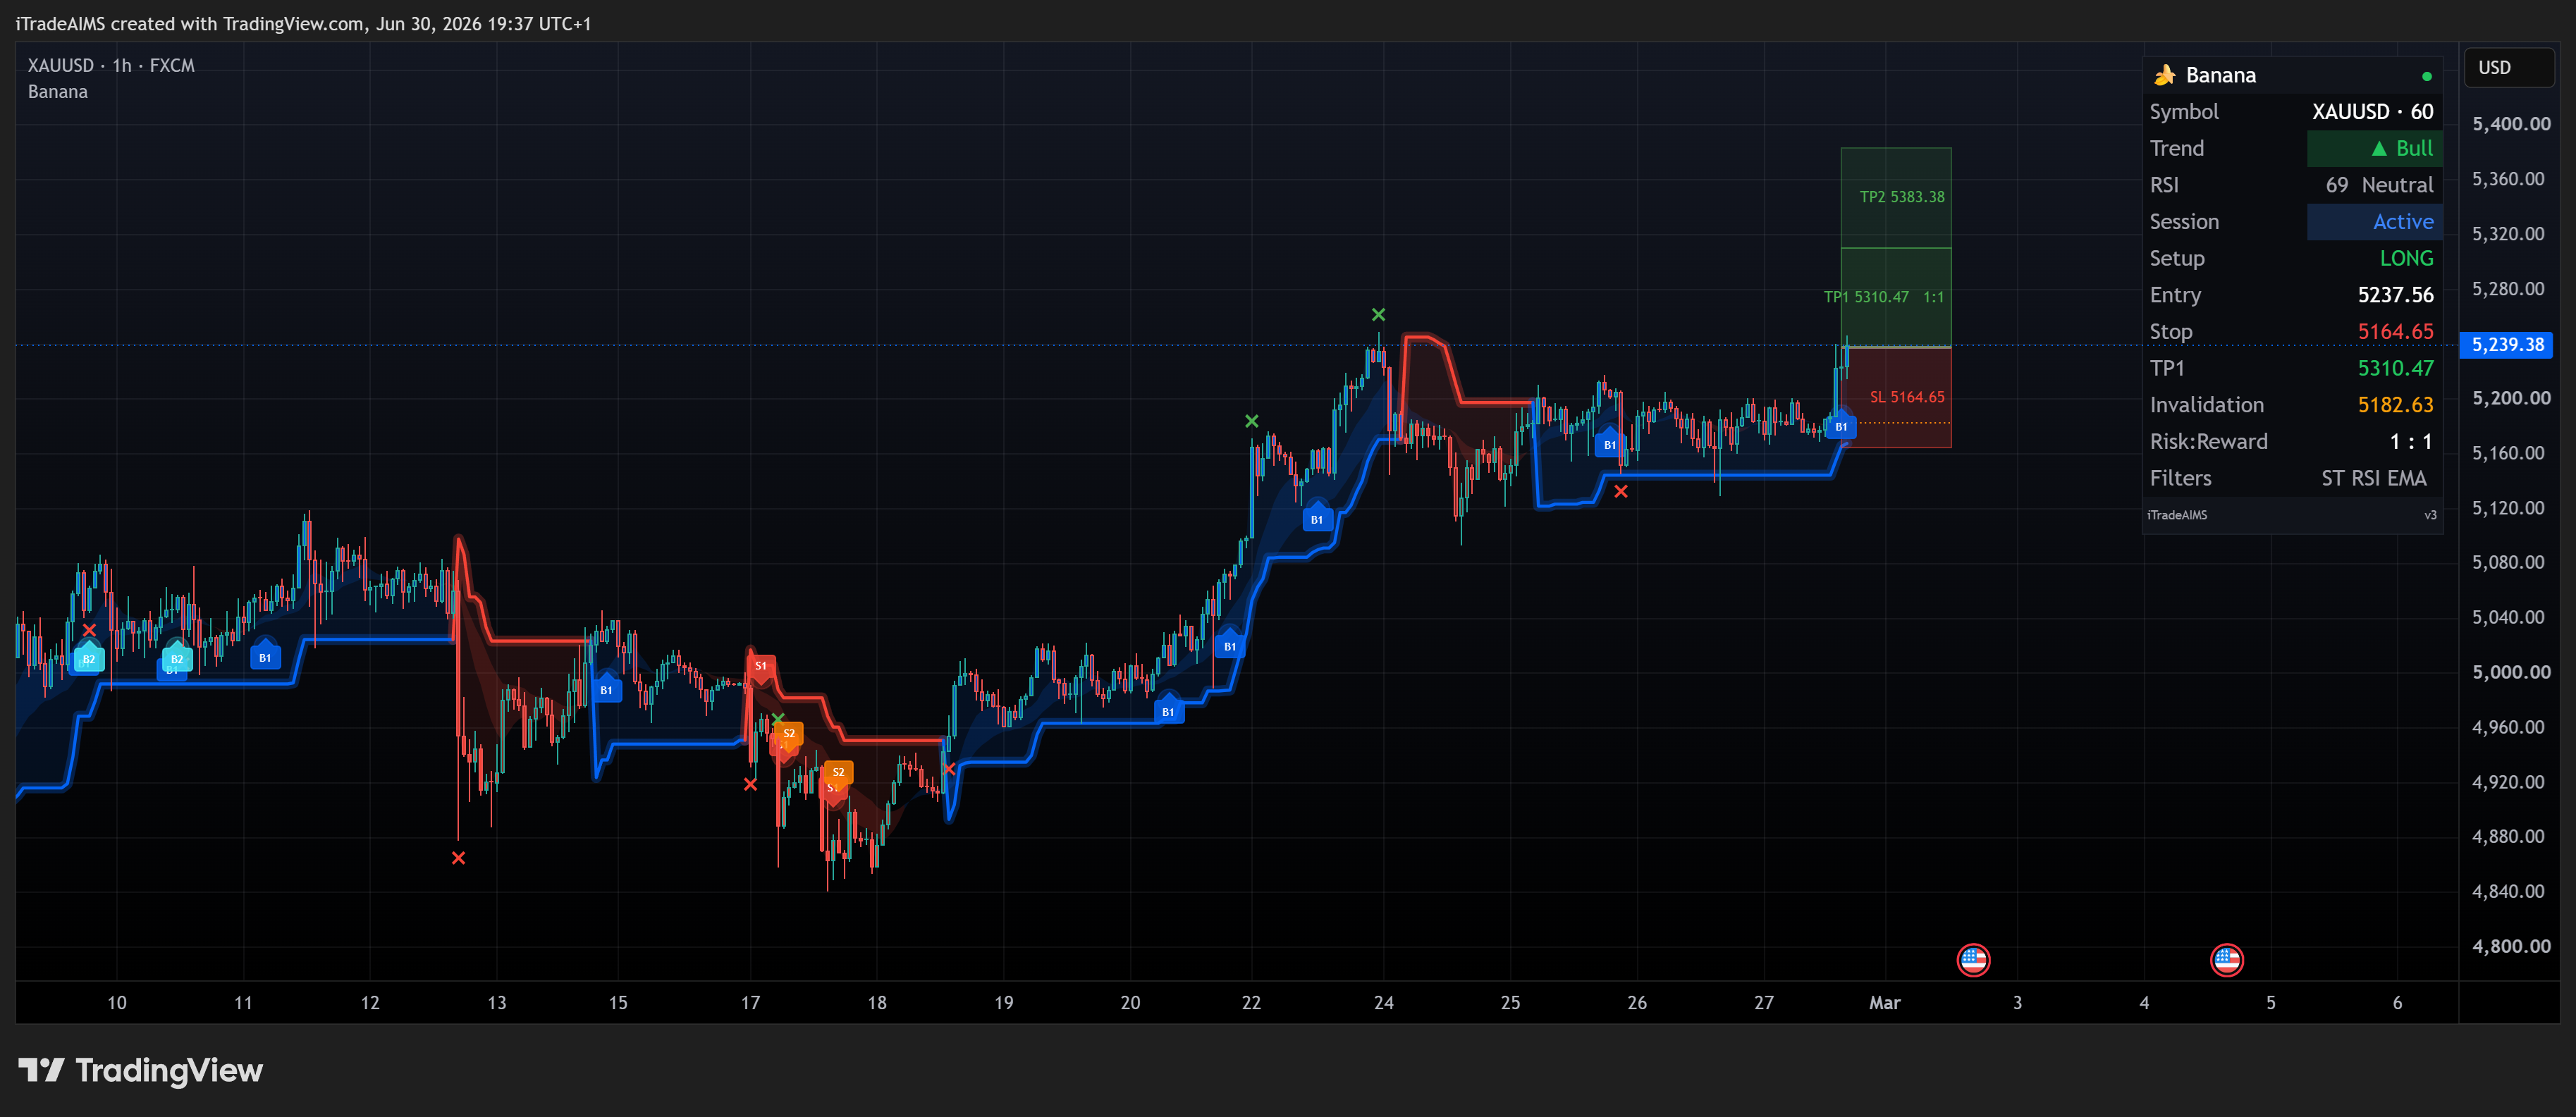
B1 Banana Buy Signal
Chart: XAUUSD H1 · Signal: B# at a consolidation break
What to look for:
- B# label below the bar at the break
- Shaded LONG entry / stop / TP zones
- Smart Trail bullish (blue glow)
- Dashboard LONG row with Entry, Stop, TP1, Invalidation, Risk:Reward
Open Banana snapshot on TradingView
Optional second lens (same move): AIMS Box Setup 1 Ready on the same period — Ready · Setup 1, BuyStop entry.
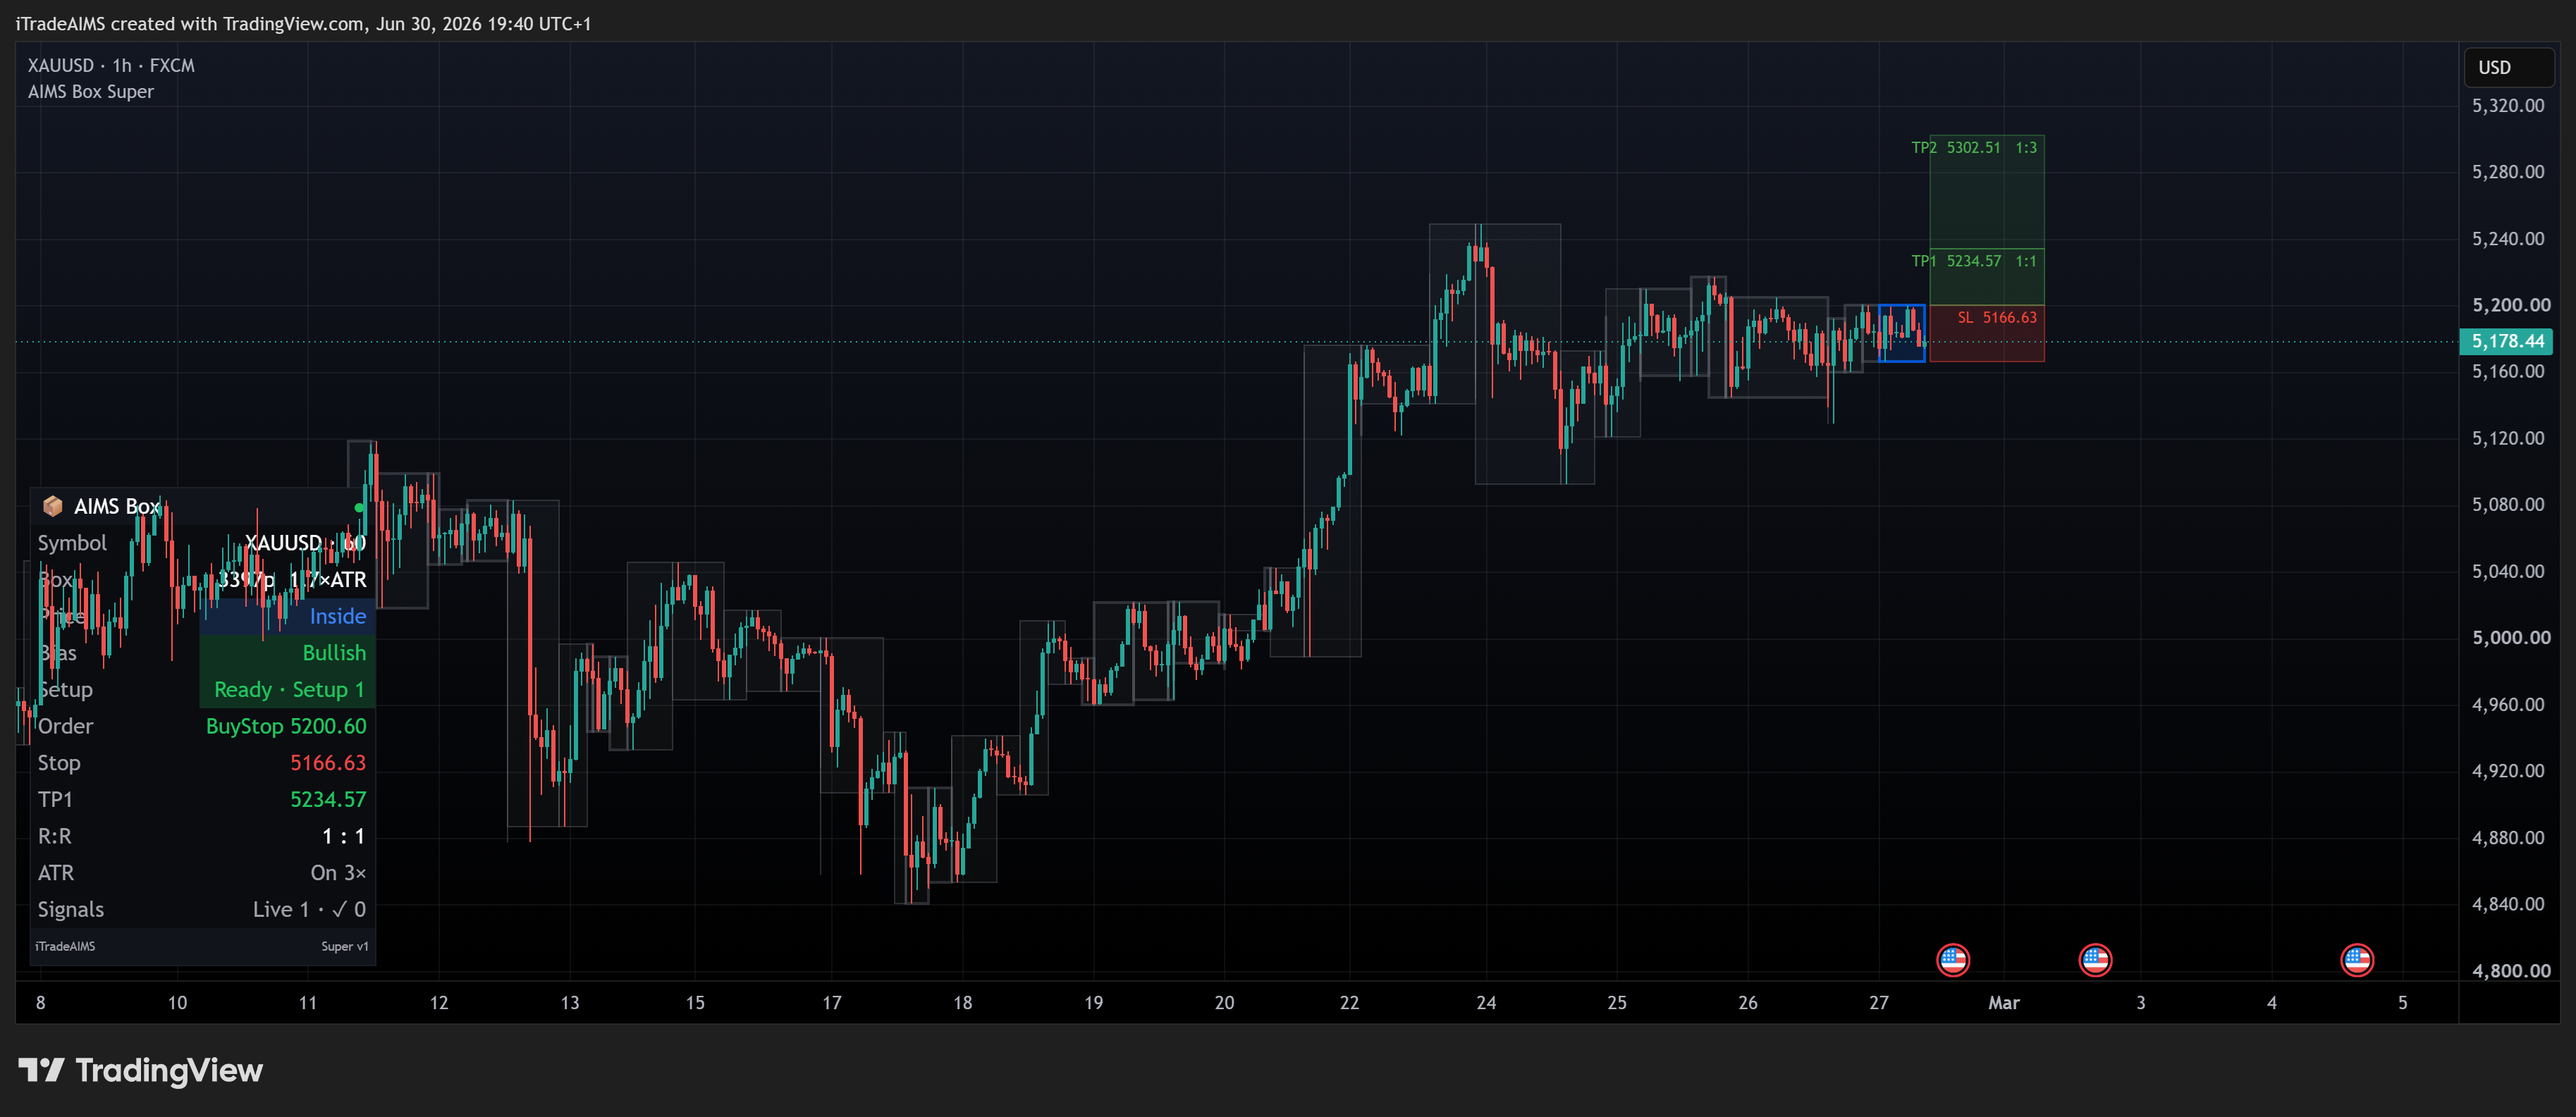
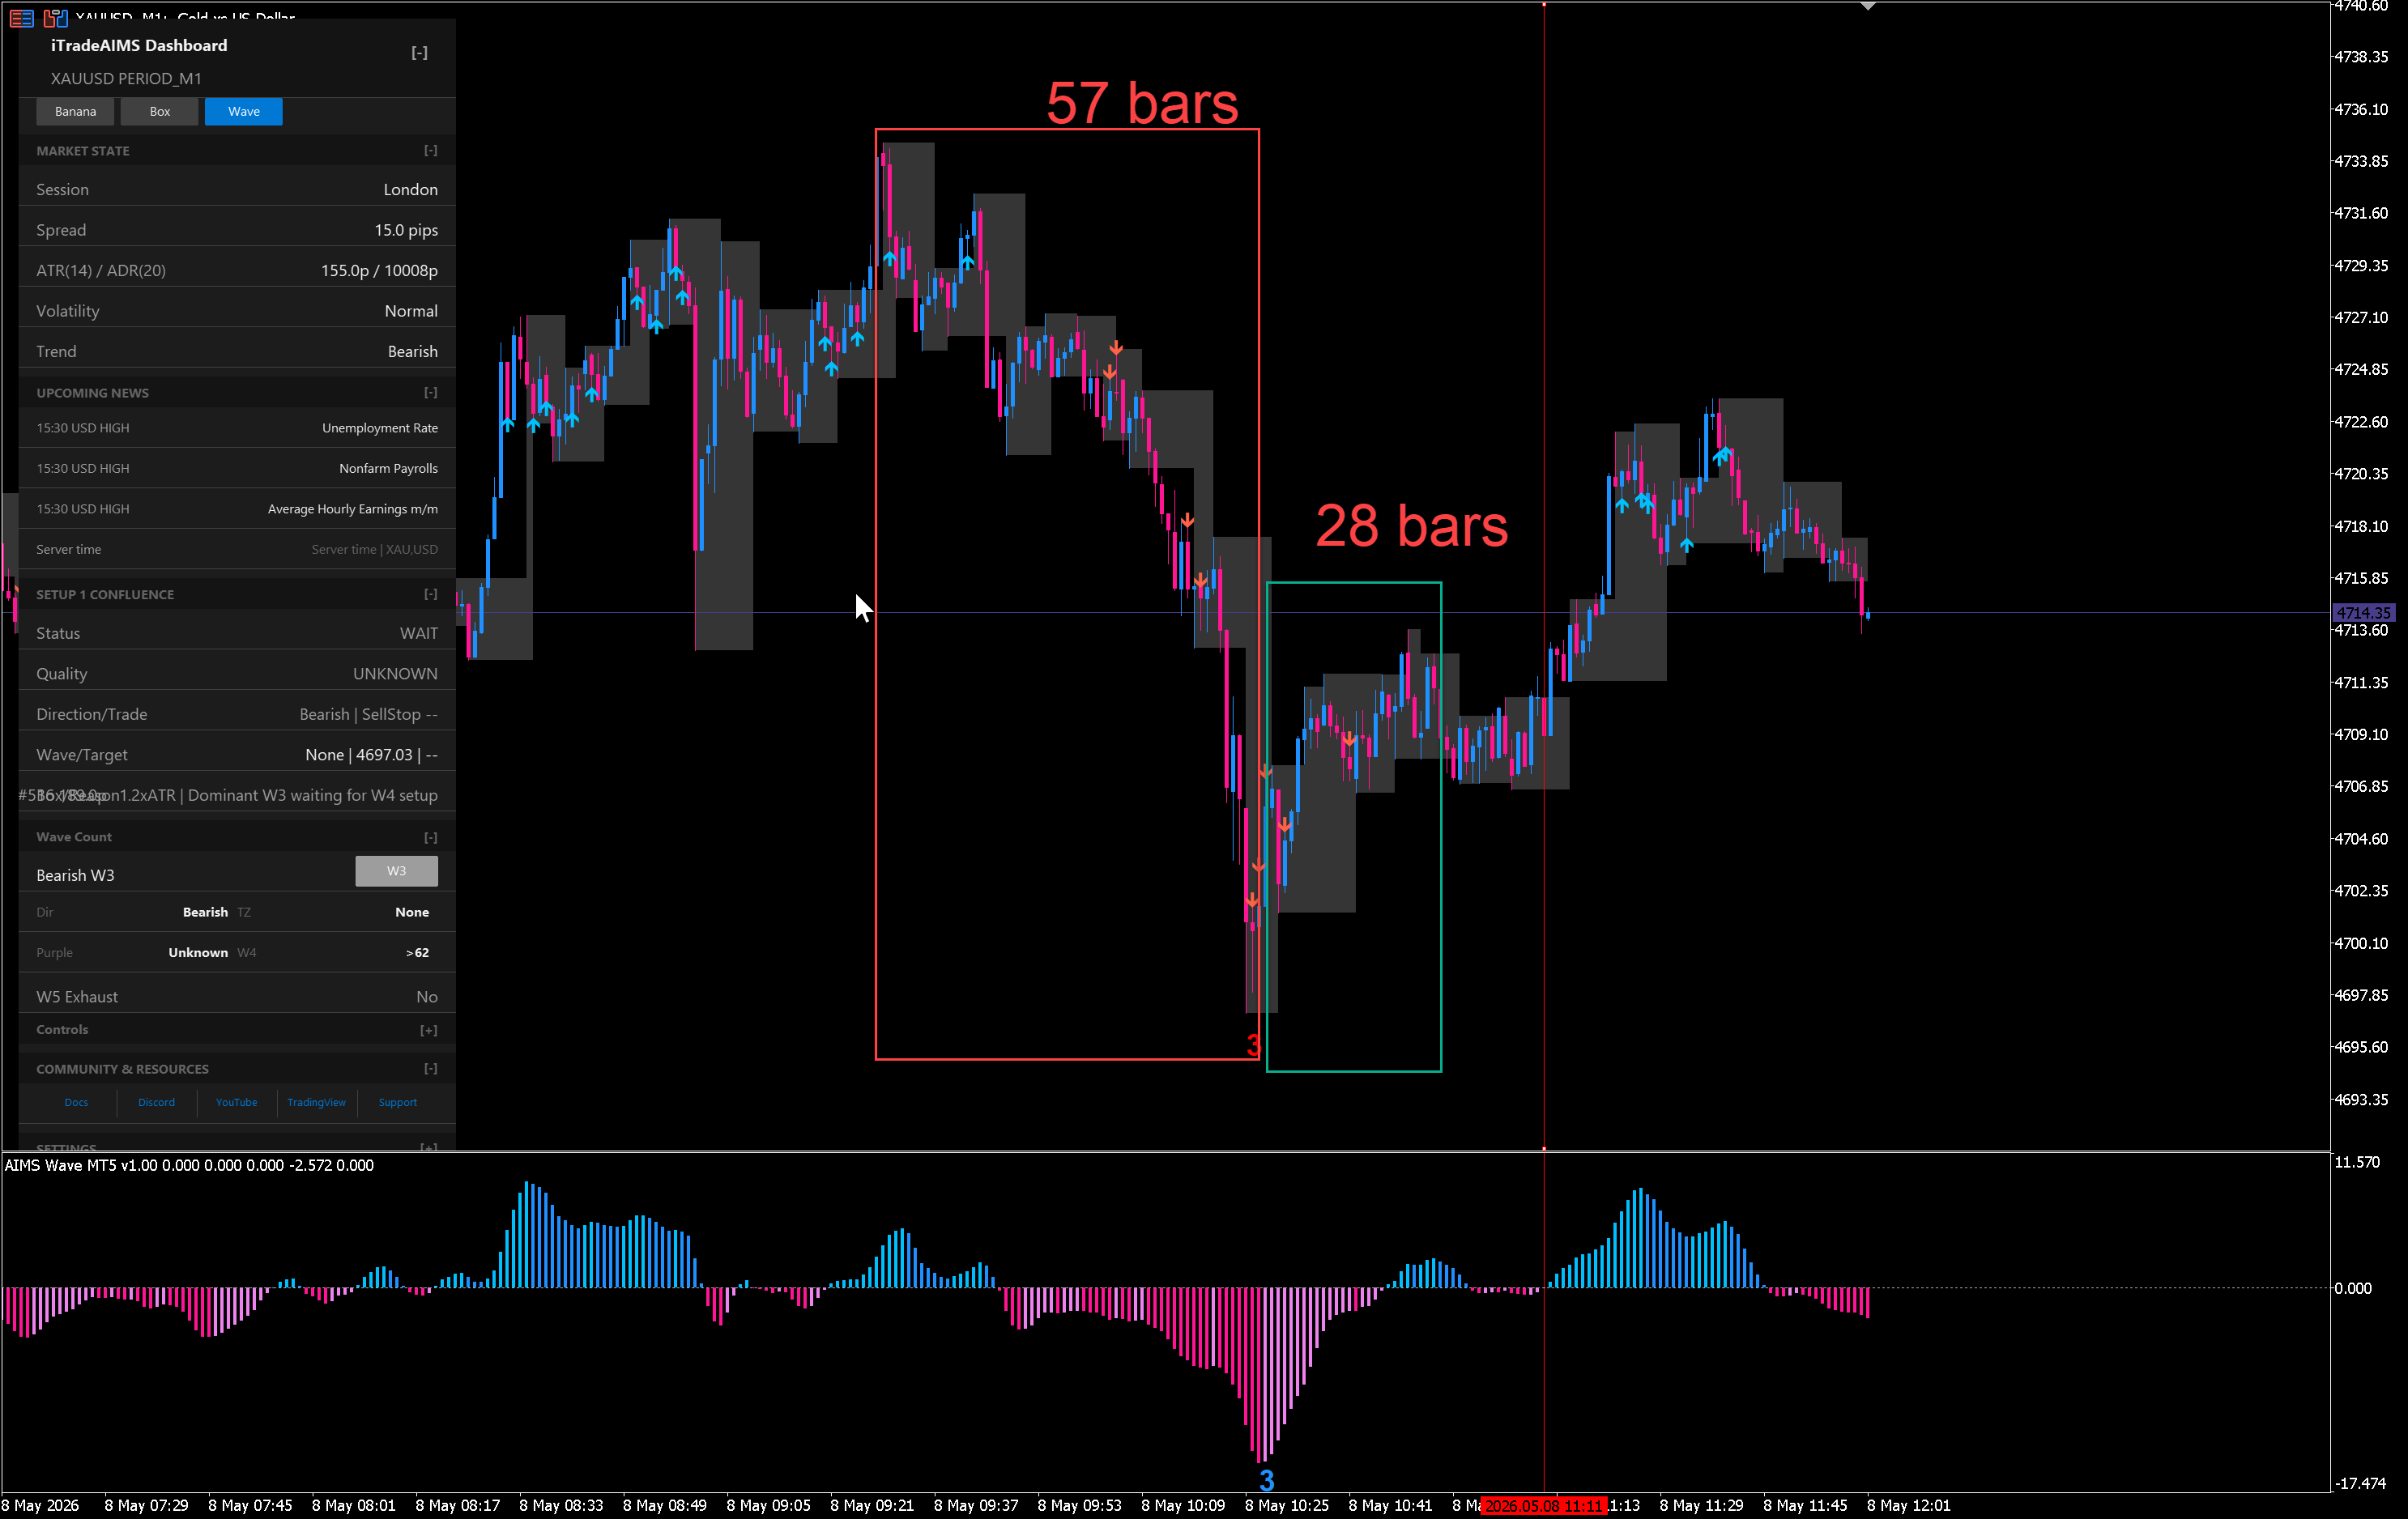
AIMS Box grades this as strong Setup 1 Ready territory. AIMS Wave can read the structure as a wave 5 entry after wave 4 consolidation. Banana prints B# on its own — confluence is for the full stack. See AIMS Box in the suite and AIMS Wave in the suite.
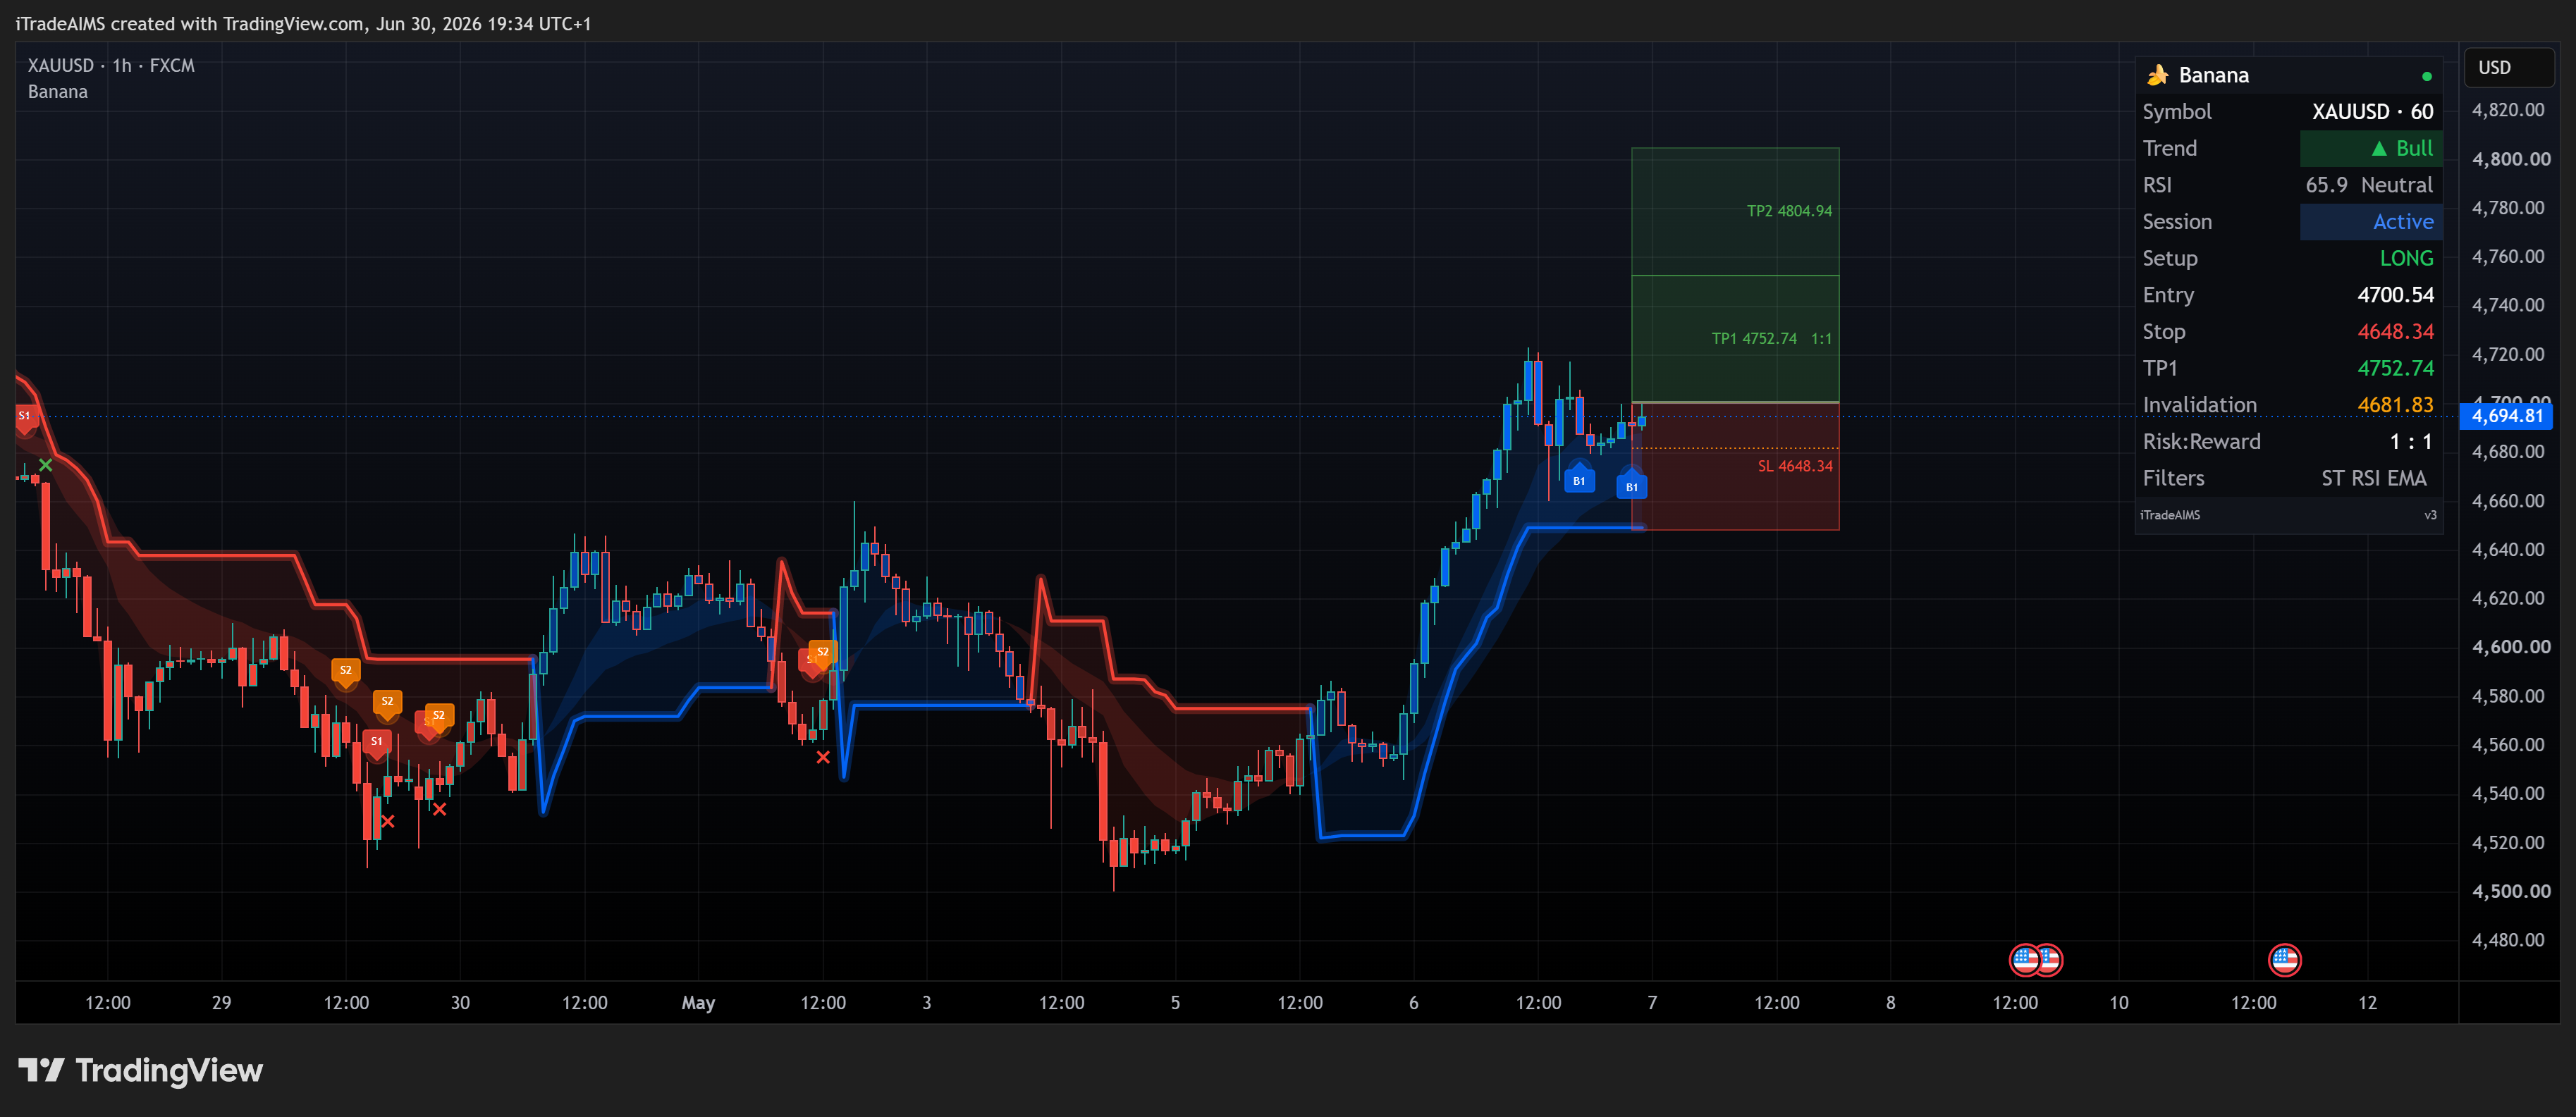
B2 Banana Buy Signal
Chart: XAUUSD H1 · Signal: B# LONG zones live
What to look for:
- Price reaches TP1 (green zone); an exit mark (x) may print
- Price fades before TP2 — common when momentum stalls after the first target
- Plan note: many traders bank partial at TP1 and move stop to break-even on the runner
Sell signal examples
| # | Scenario | Signal | Outcome |
|---|---|---|---|
| S1 | Banana sell signal | S# → trail → both TPs | Full target sequence |
| S2 | Losing sell | S# SHORT live | Stop hit (exit mark at SL) |
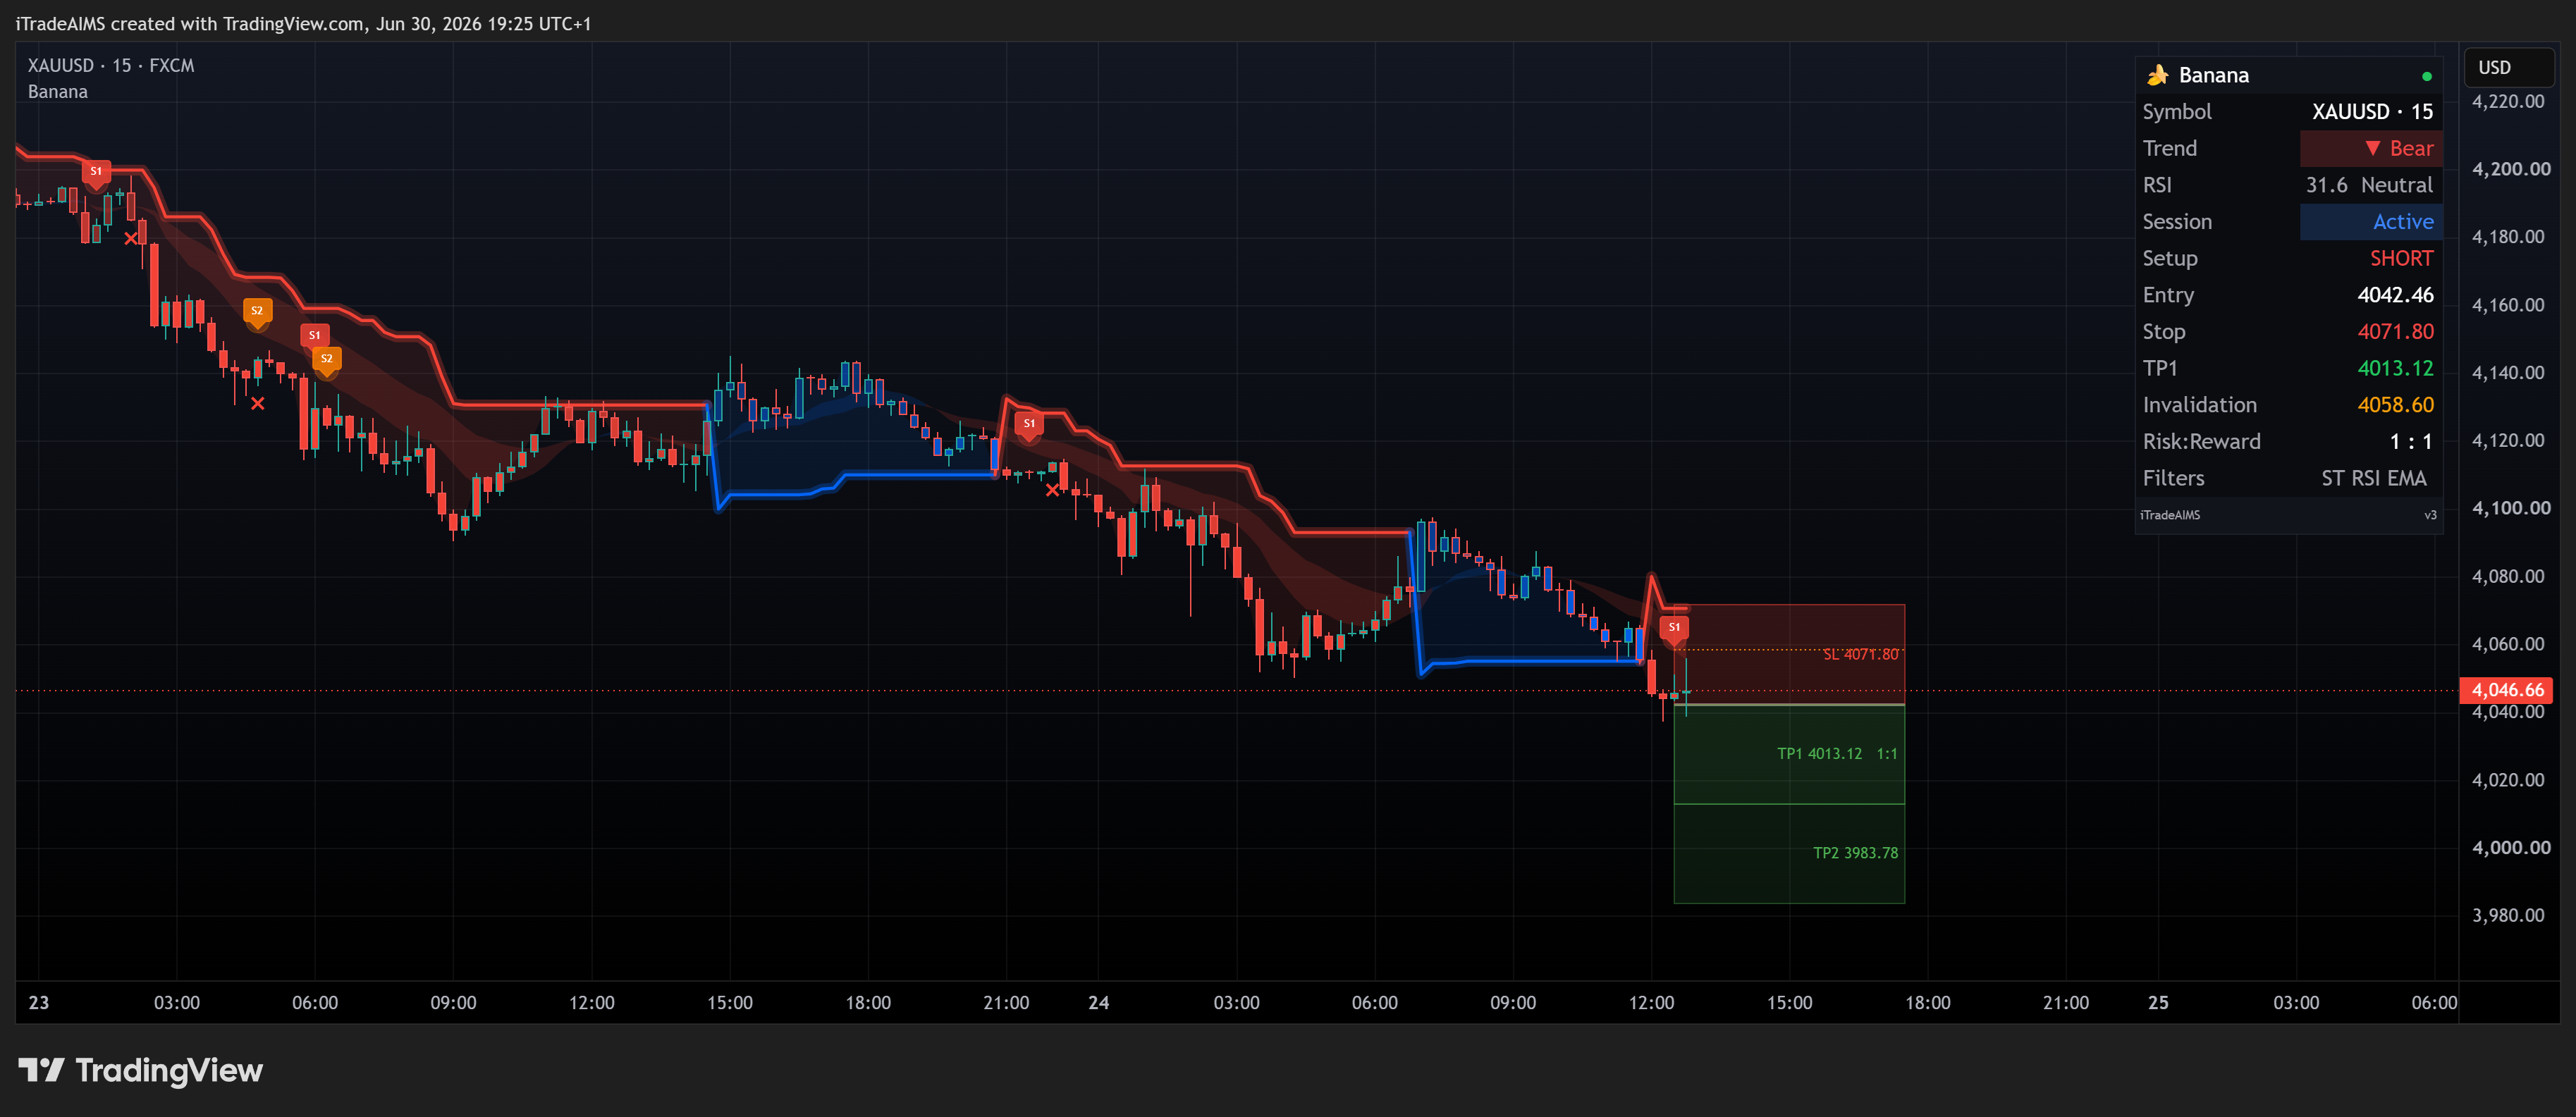
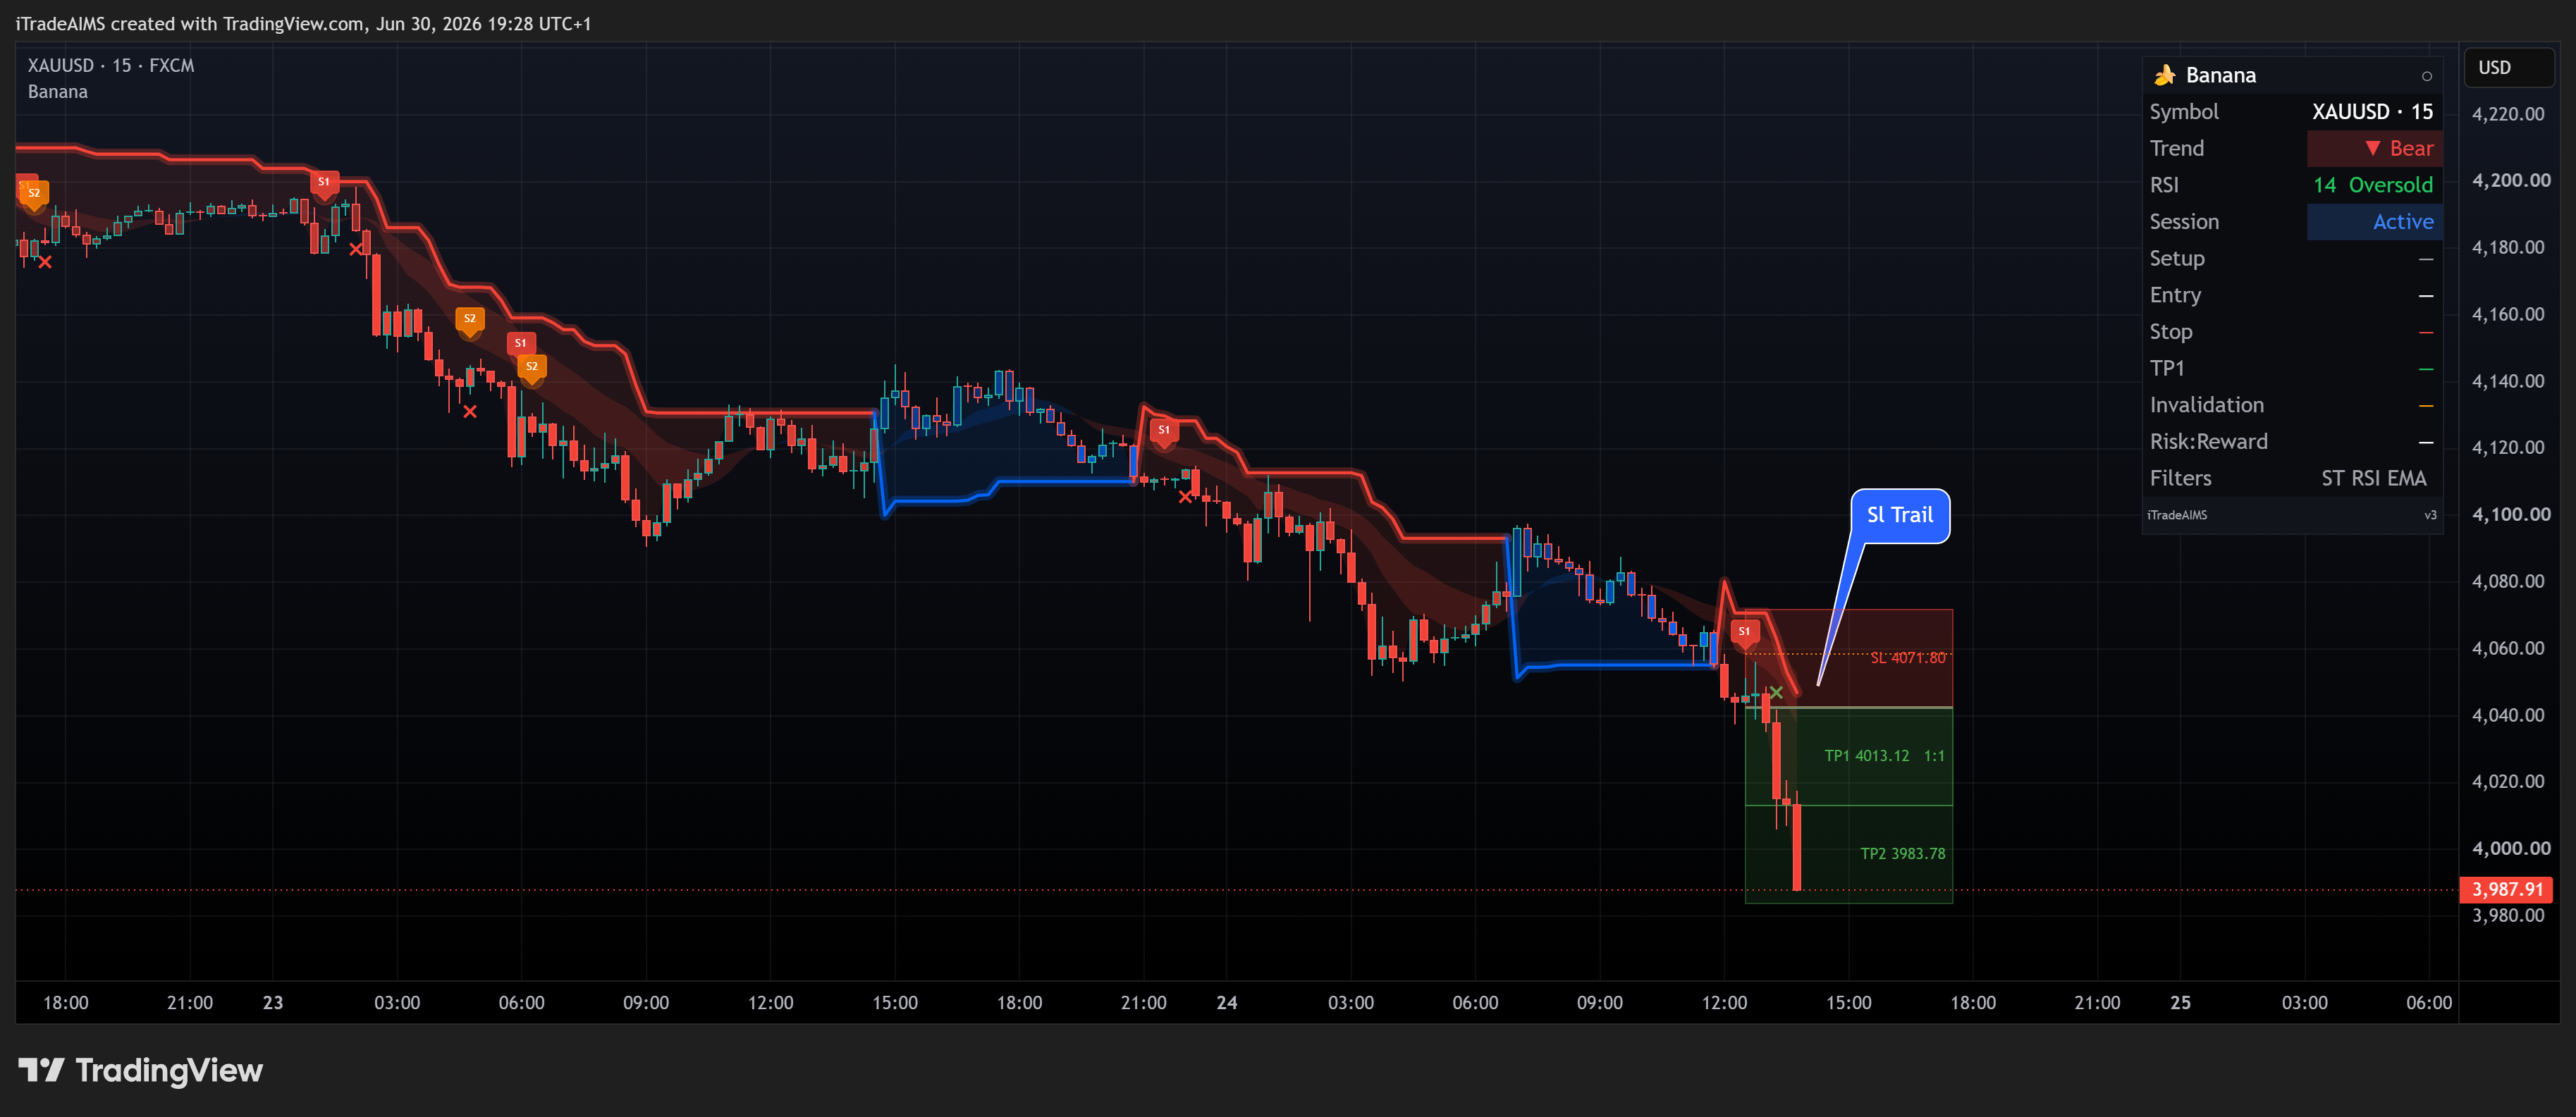
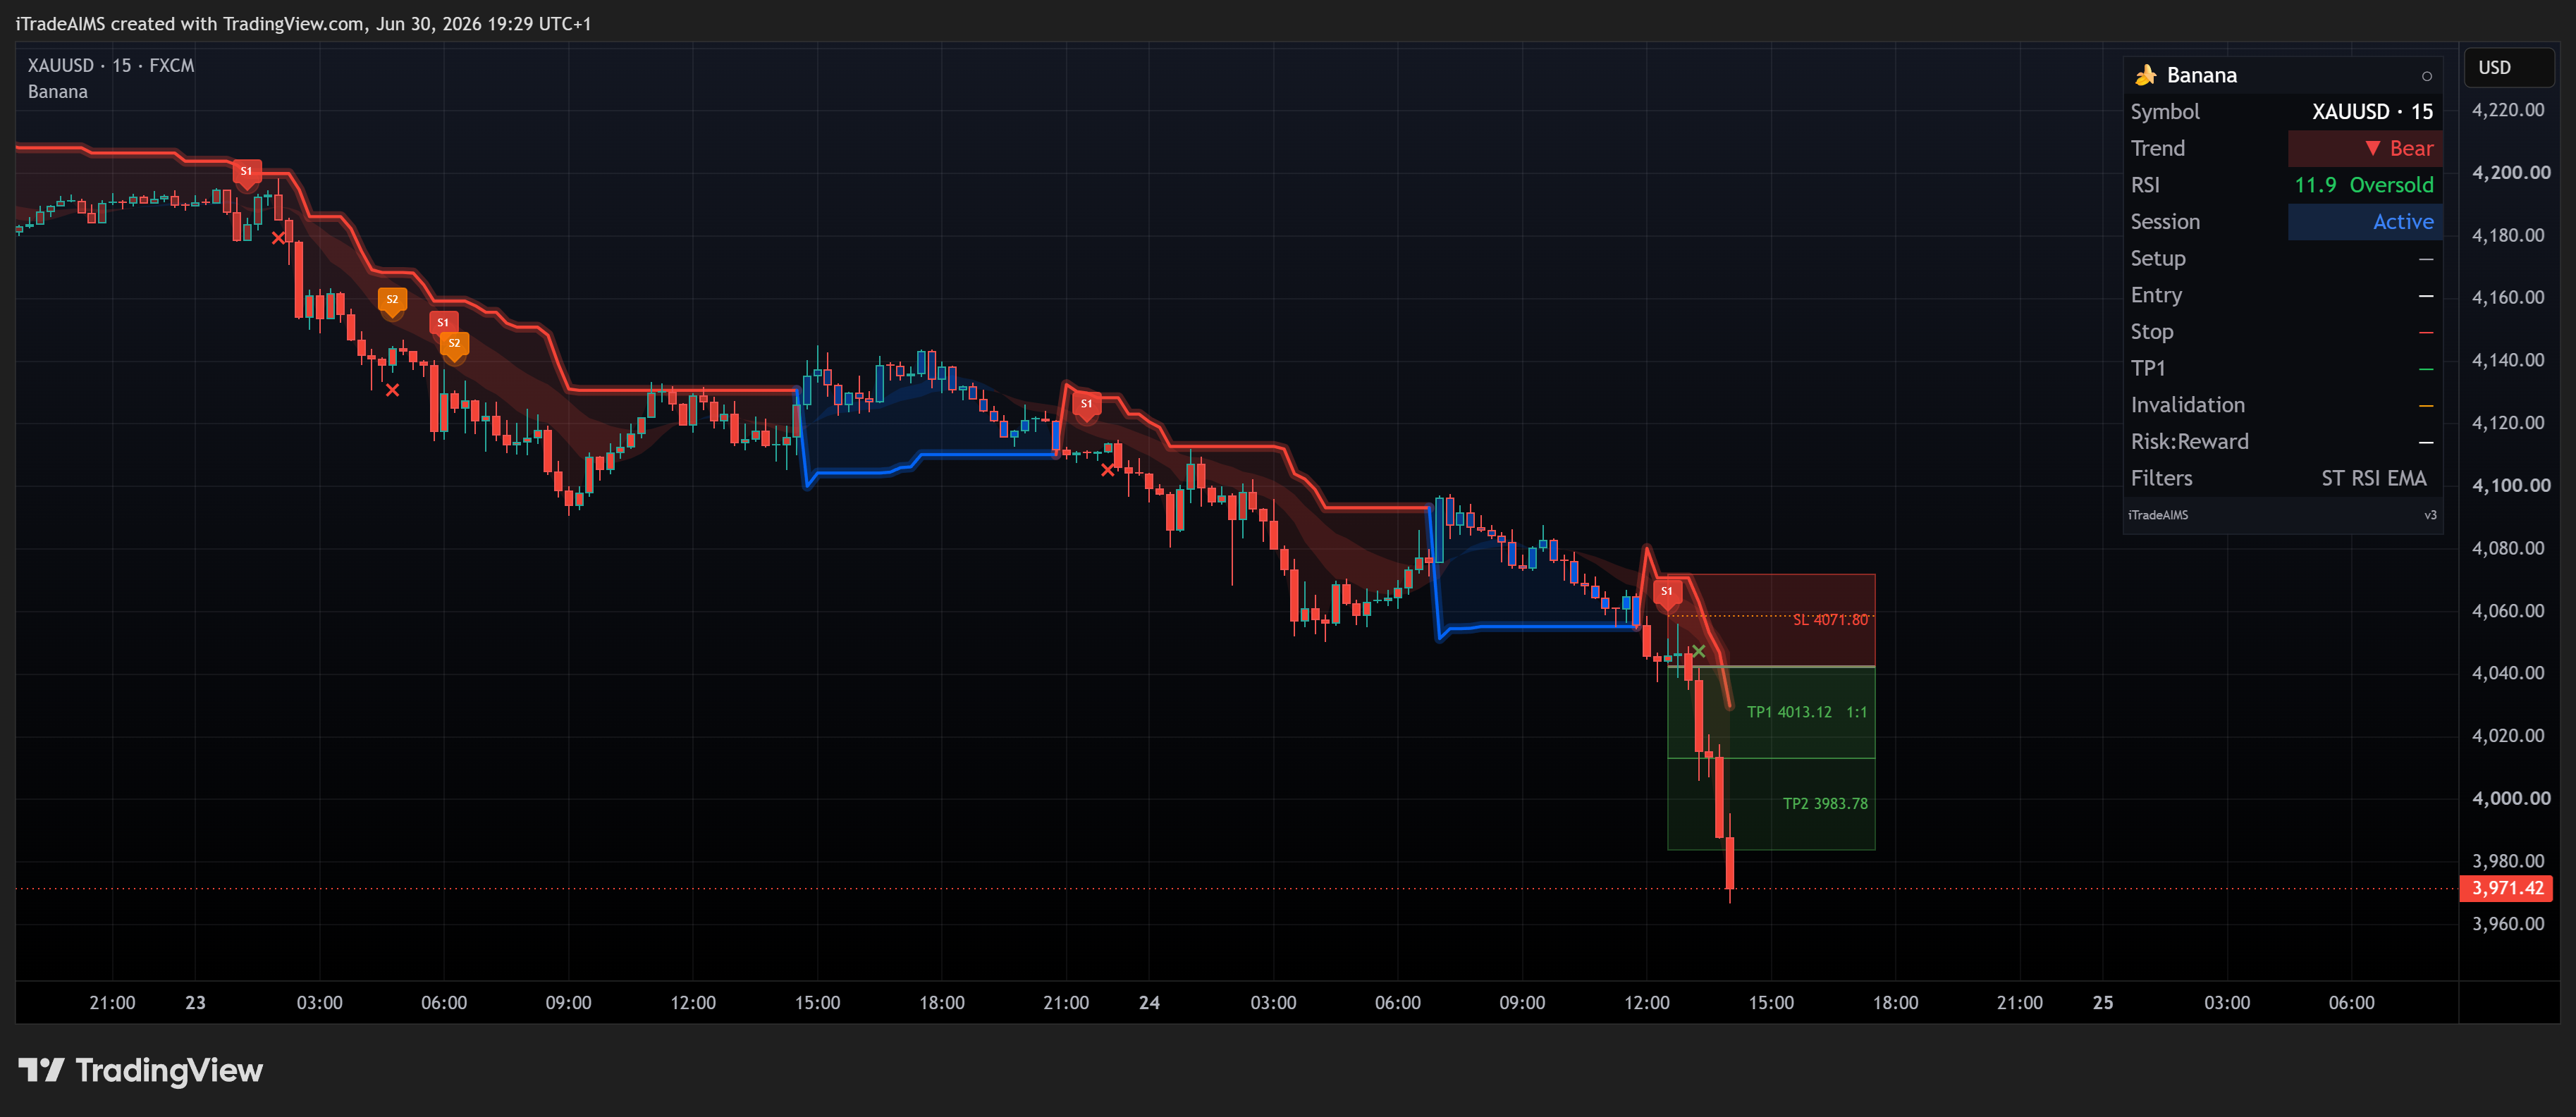
S1 Banana Sell Signal
Chart: XAUUSD · Signal: S# with SHORT zones — signal → trail → both TPs
Walkthrough in three snapshots:
| Step | Snapshot | What to look for |
|---|---|---|
| 1 | Signal fires | S# label, SHORT zones, dashboard SHORT |
| 2 | Trail the stop | Smart Trail tracks the down-move |
| 3 | Both TPs hit | TP1 + TP2 tagged; exit marks (x) |
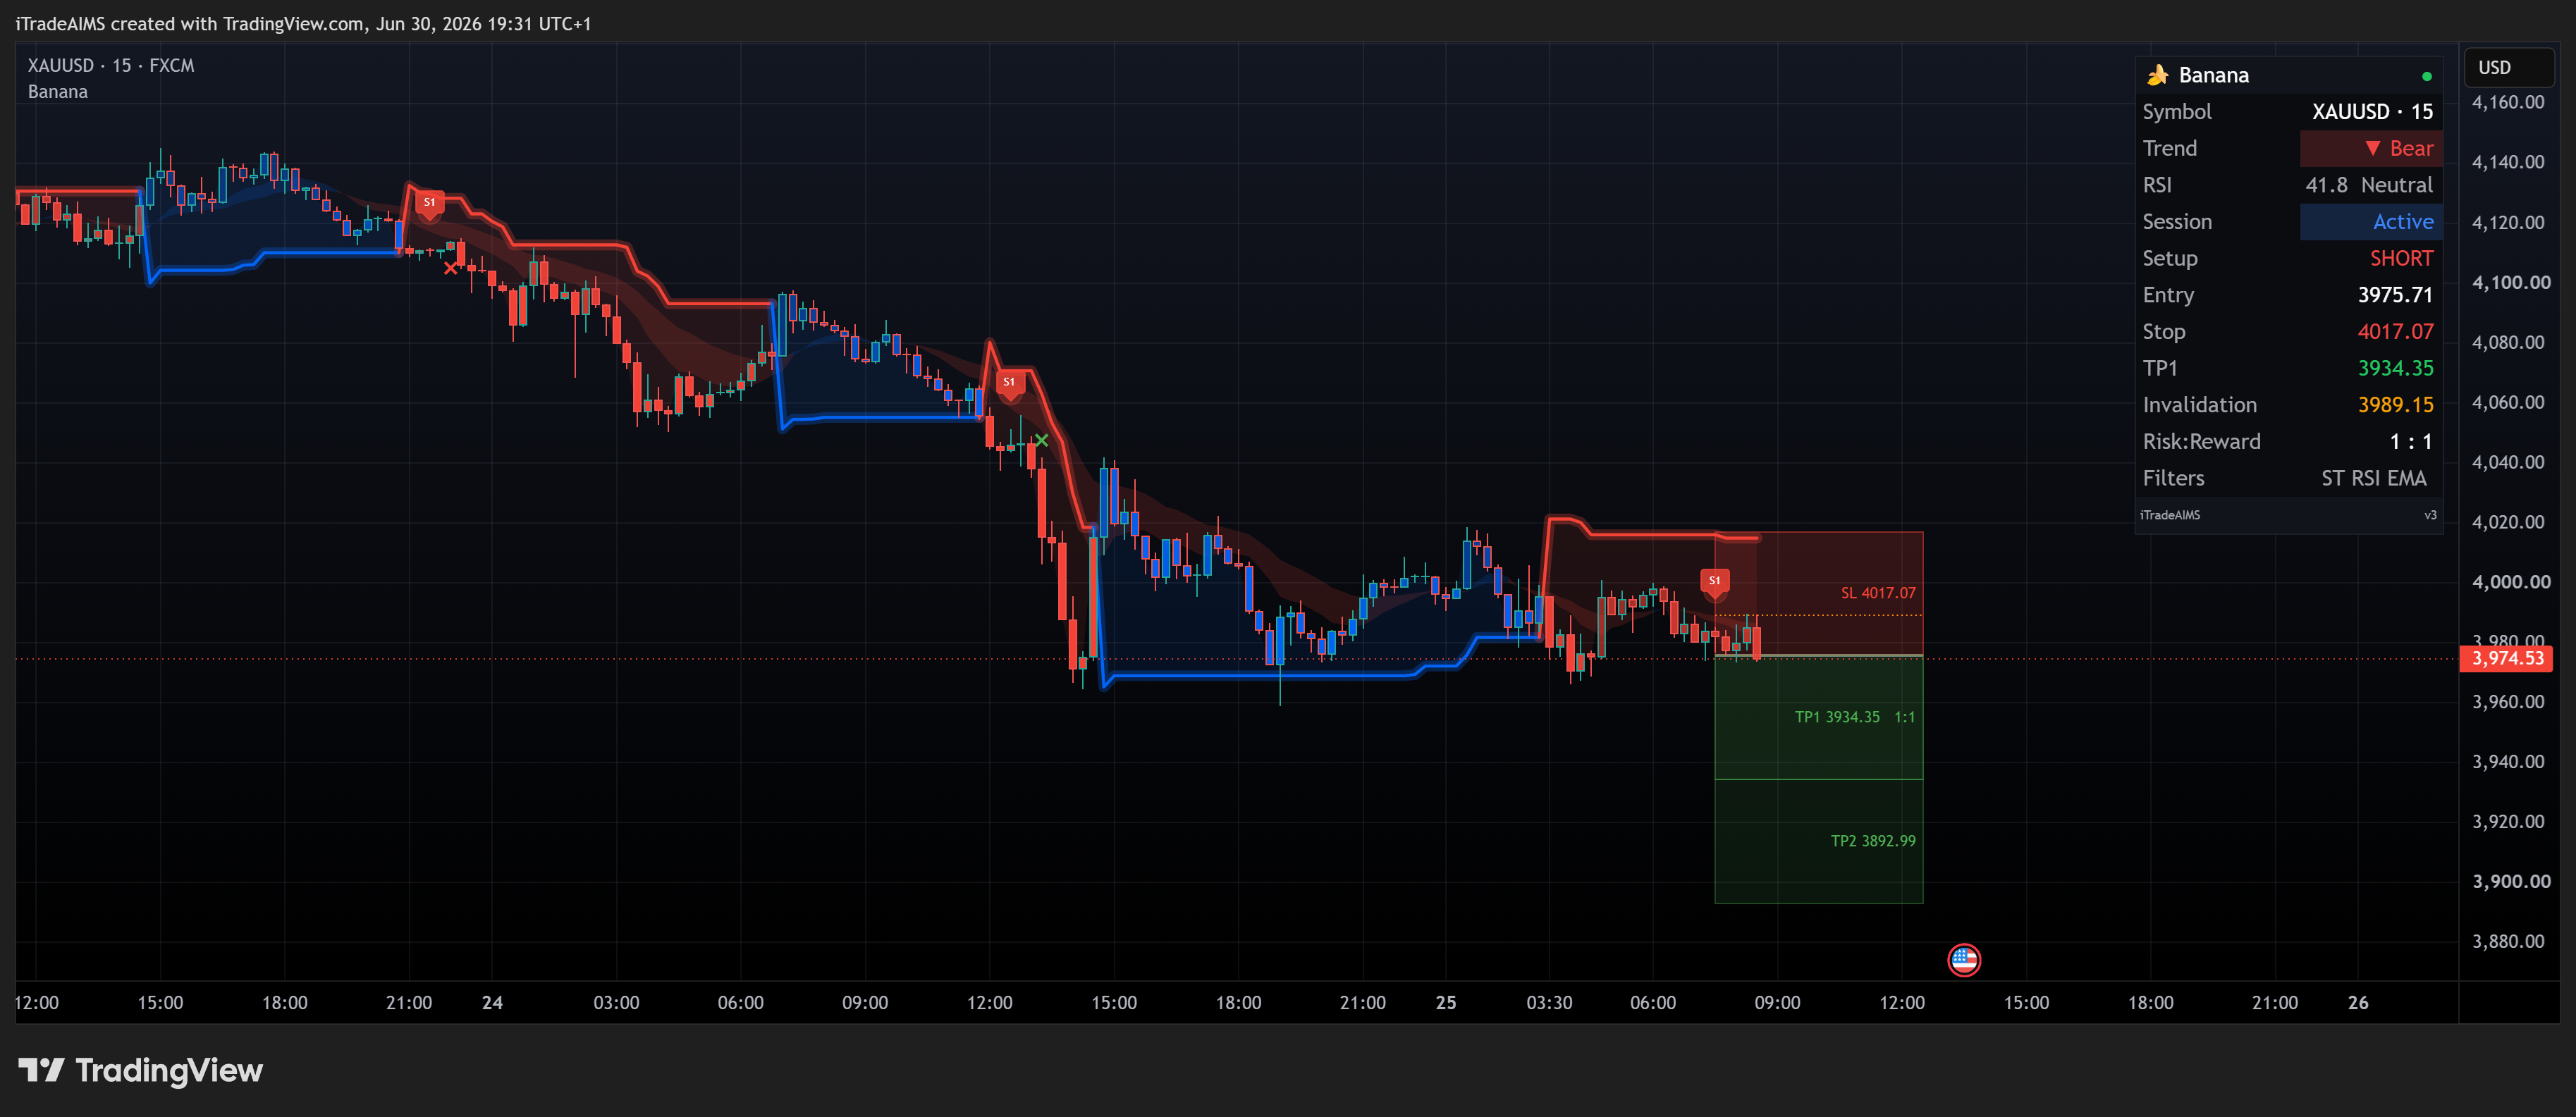
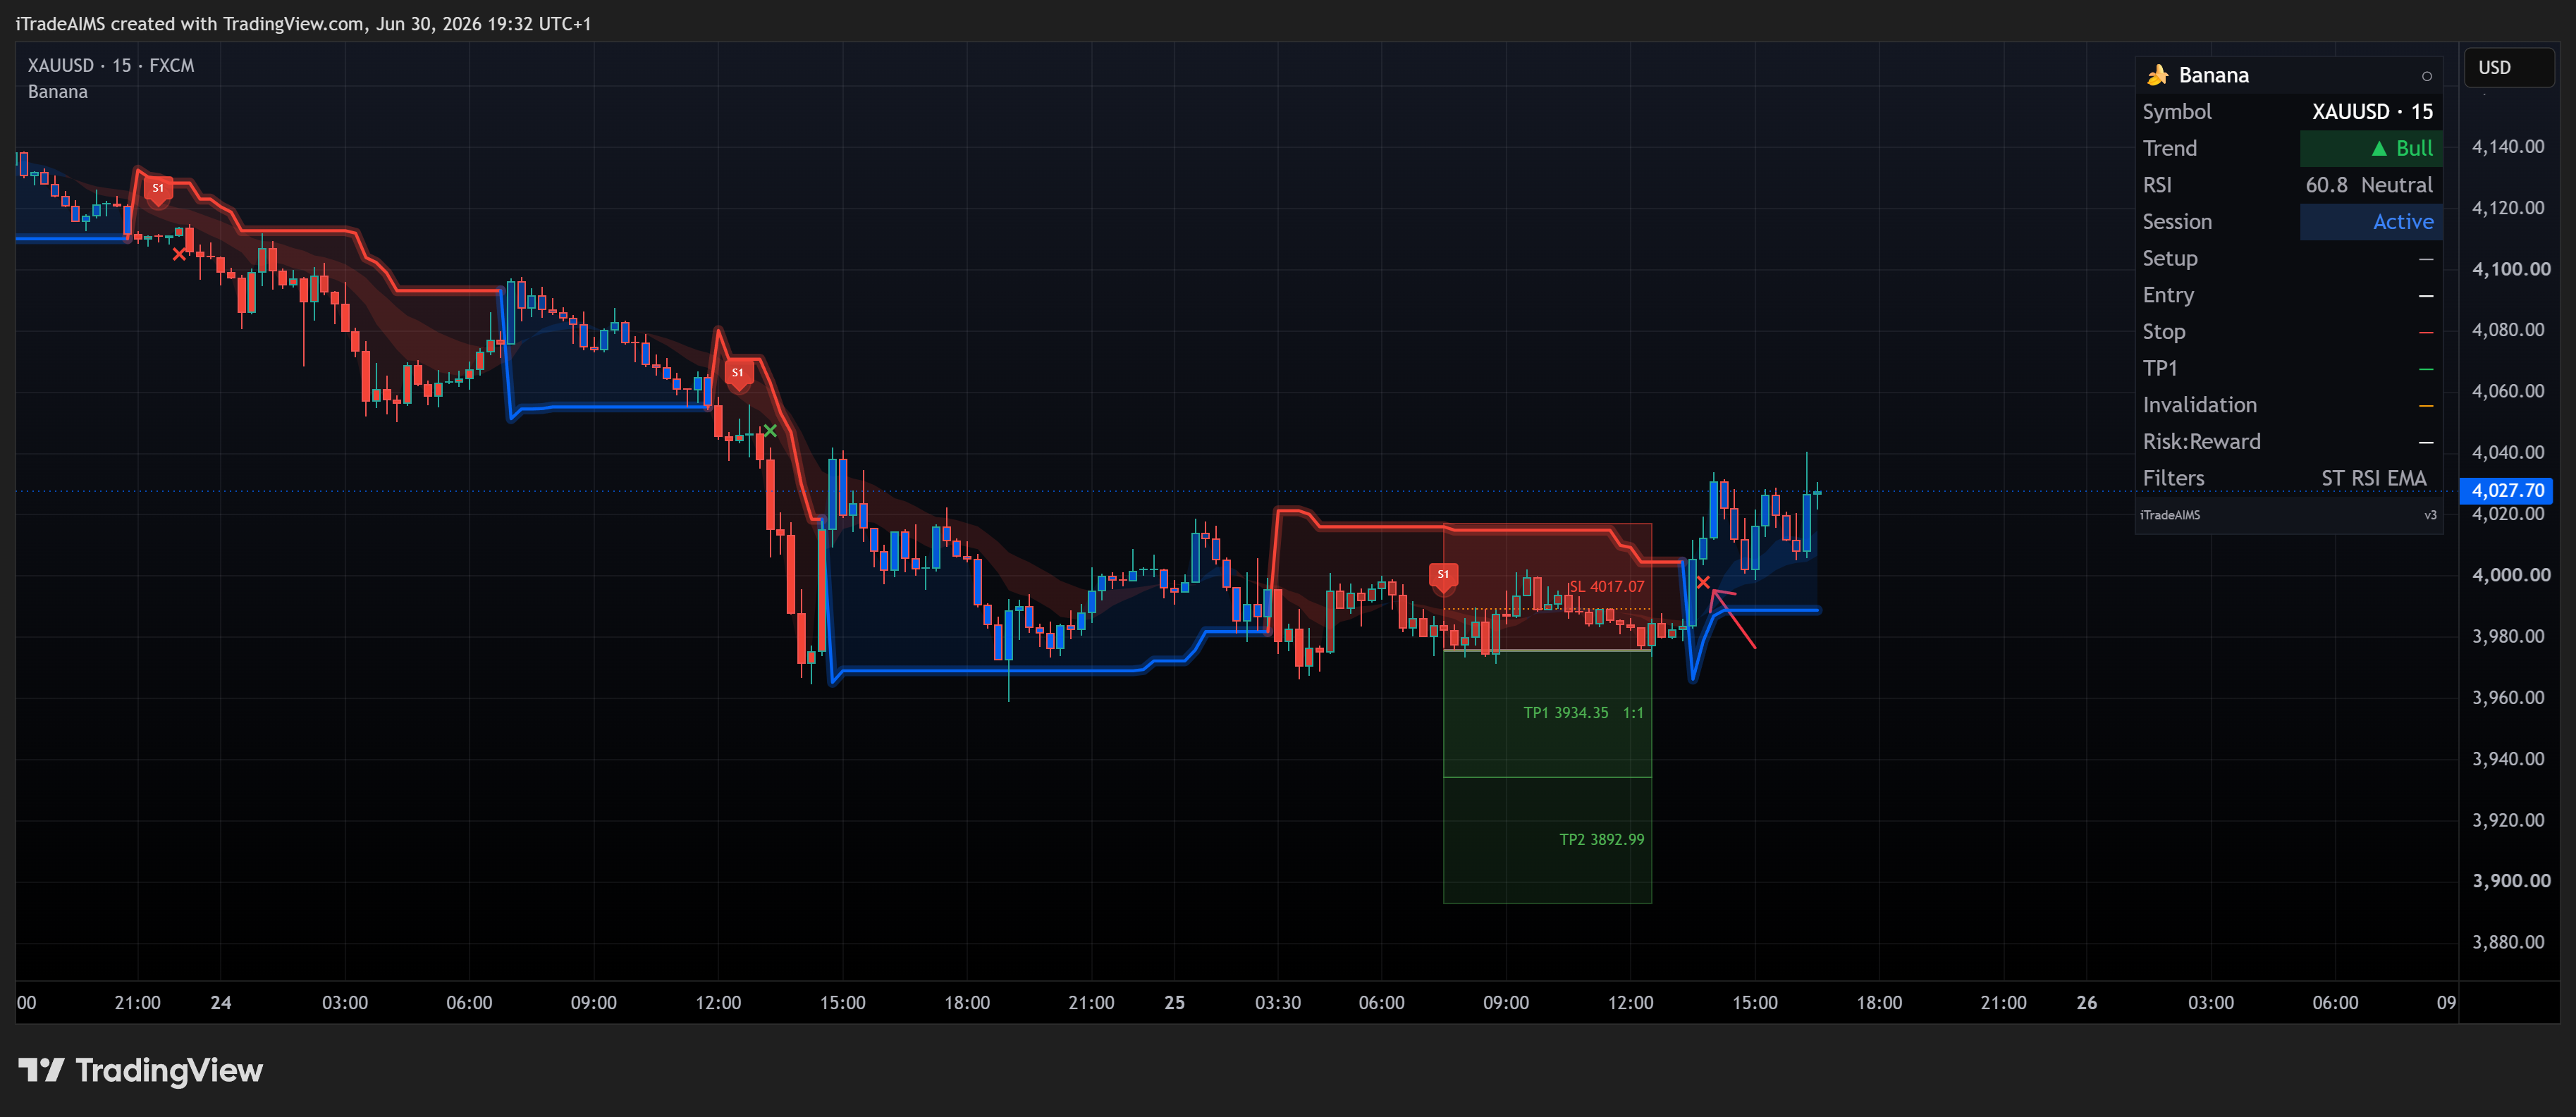
S2 — Losing sell (stop hit)
Chart: XAUUSD M15 · Signal: S# SHORT — price moves against the setup
What to look for:
- S# with red stop zone; price pushes into SL
- Exit mark (x) at the stop when the level is hit
- Not every setup wins — use stops as drawn, not as suggestions to ignore
| Step | Snapshot | What to look for |
|---|---|---|
| 1 | SHORT live, toward stop | Entry, stop (red), TP zones; price moving into SL |
| 2 | Stop hit | Exit mark (x) at stop |
Related pages
- Start Here — add the script and read defaults first
- Signal detection — what B# / S# mean
- Validate a signal — checklist before you act
- TradingView alerts — Banana Buy / Banana Sell on bar close